Policy Study

California Ranks 47th in the Nation in Highway Performance and Cost-Effectiveness


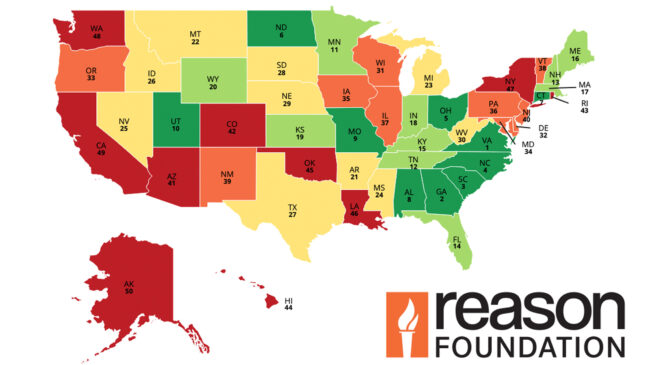
California’s highway system ranks 47th in the nation in overall cost-effectiveness and condition, according to the Annual Highway Report by Reason Foundation. This is a two-spot decrease from 45th in the previous report. However, some categories in the report cannot be compared to previous years due to methodological changes that also impacted some states’ overall rankings. These changes are fully explained in Part 2 and the appendix of the full report.

California ranks in the bottom 10 nationally in seven categories. The only category the state ranks higher than average in is urban fatality rate, ranking 23rd. The state’s 1.62 maintenance disbursement per lane-mile ratio is 2.4 times higher than peer state Texas’ ratio but lower than peer state New York’s ratio. The state’s 1.55 other disbursement per lane-mile ratio is 1.5 times higher than Texas’ ratio but lower than New York’s ratio. On rural Interstates, the state’s 4.52% of pavement is in poor condition is 3.5 times higher than Texas’ percentage and twice as high as New York’s percentage. On urban Interstates, the state’s 9.38% of pavement in poor condition is 2.5 times higher than Texas’ percentage and similar to New York’s percentage. The state’s 2.32% of poor rural arterial pavement quality is eight times higher than Texas’ rate and twice as high as New York’s rate. California’s 39.80% of poor urban arterial pavement quality is three times higher than Texas’ percentage and twice as high as New York’s percentage. California’s drivers waste 31.3 hours a year in traffic congestion, a large number, but fewer hours than drivers in Texas or New York. 

In safety and performance categories, California ranks 39th in rural fatality rate, 23rd in urban fatality rate, 25th in structurally deficient bridges, 44th in traffic congestion, 47th in urban Interstate pavement condition, and 46th in rural Interstate pavement condition. 

The state ranks 36th in capital and bridge spending per mile and 44th in maintenance costs per mile.

California’s best rankings are in urban fatality rate (23rd) and structurally deficient bridges (25th). 

California’s worst rankings are in urban arterial pavement condition (50th) and urban Interstate pavement condition (47th). 

California’s drivers waste 31.3 hours a year in traffic congestion, ranking 44th in the nation. 

California’s state-controlled highway mileage makes it the ninth largest highway system in the country.

“To improve in the report’s overall rankings, California needs its high spending to translate into better system quality. For example, the state is in the bottom 20 in all four of the spending categories yet is also in the bottom 10 in all four of the pavement categories. It also ranks in the bottom 15 in two of the three fatality categories. Finally, the state also needs to find a way to decrease its traffic congestion somewhat,” said Baruch Feigenbaum, lead author of the Annual Highway Report and senior managing director of transportation policy at Reason Foundation. “While it may be challenging for California to reduce its spending, it needs to improve its pavement quality, fatality rates, and urbanized area congestion. The state has a lot of work to do. But if it is able to improve system performance, it could move up significantly in the rankings.” 

Additional Analysis 

Reason Foundation’s Annual Highway Report measures the condition and cost-effectiveness of state-controlled highways in 13 categories, including pavement condition, traffic congestion, structurally deficient bridges, traffic fatalities, and spending (capital, maintenance, administrative, other) per mile.

Compared to nearby states, California’s overall highway performance is worse than Nevada (ranks 21st), Oregon (ranks 37th), and Arizona (ranks 30th). 

California ranks behind some comparable states, such as Texas (ranks 19th) and comparable to others like New York (ranks 49th). 

Last place Alaska ranks 9th in urban arterial pavement condition. Forty-ninth place New York ranks 7th in rural fatality rate. Forty-eighth place Hawaii ranks 1st in other fatality rate. What is 47th place California’s best ranking? It is 23rd in urban fatality rate. California ranks in the bottom five states not because it is abysmal in multiple categories, but because it is below average in every category except one. Costs in California are higher than in other parts of the country, such as peer state Texas. But high costs are not California’s only problem. Awful pavement quality and debilitating congestion are the areas that need the most improvement. Considering most of the state’s population lives in very large urban areas, the state’s fatality rates are high as well. California could learn a lot from peer state Texas on improving pavement quality and lowering costs, if policymakers are willing to listen. 

California is one of seven states with a maintenance disbursement ratio above 1.50. The others six are Washington, Vermont, Indiana, Alaska, New York, and Oklahoma. 

California is one of eight states with more than 3% of their rural Interstate system pavement in poor condition. The other seven are Alaska, Colorado, Washington, West Virginia, Louisiana, Pennsylvania, and Michigan. 

California is one of eight states that reported more than 7% of their urban Interstate pavement in poor condition. The other seven are Louisiana, New York, New Jersey, West Virginia, Delaware, Michigan, and Hawaii.

California is one of five states with more than 20% of their urban arterial pavement in poor condition. The other four are Rhode Island, Nebraska, Massachusetts, and New York.  

California is one of nine states where automobile commuters spend more than 30 hours annually stuck in peak-hour traffic congestion. The other eight are New Jersey, New York, Massachusetts, Texas, Rhode Island, Illinois, Delaware, and Connecticut.

California is one of 24 states that have other fatality rates of 1.5 per 100 million vehicle-miles traveled or higher. The other 23 are West Virginia, Mississippi, Kentucky, Louisiana, South Carolina, Montana, Oklahoma, Oregon, Texas, Kansas, Tennessee, North Carolina, South Dakota, New Mexico, Pennsylvania, Washington, Georgia, Maine, Michigan, Missouri, Virginia, Illinois, and Ohio. 

*2021 data
The Annual Highway Report is based on spending and performance data submitted by state highway agencies to the federal government and urban congestion data from the Texas A&M Transportation Institute for 2020 as well as bridge condition data from the Better Roads inventory for 2021. For more details on the calculation of each of the 13 performance measures used in the report, as well as the overall performance measure, please refer to the appendix in the main report. The report’s dataset includes Interstate, federal, and state roads, but not county or local roads. All rankings are based on performance measures that are ratios rather than absolute values: the financial measures are disbursements per mile, the fatality rate is fatalities per 100 million vehicle-miles of travel, the urban congestion measure is the annual delay per auto commuter, and the others are percentages. For example, the state ranking 1st in structurally deficient bridges has the smallest percentage of structurally deficient bridges, not the smallest number of structurally deficient bridges.

Policy Study

California Ranks 45th in the Nation in Highway Performance and Cost-Effectiveness


California’s highway system ranks 45th in the nation in overall cost-effectiveness and condition, according to the Annual Highway

Report by Reason Foundation. This is a two-spot decrease from 43rd in the previous report.

California ranks in the bottom 10 nationally in six categories. The state does not rank higher than average (25th) in any category. Put simply, the state does many things poorly and nothing well. California’s per mile spending ($206,924) is three times that of Texas ($75,153). And what is California receiving for that high spending? It’s not smooth roads. On rural Interstates, 3.05% of pavement is in poor condition while in Texas the percentage is 0.75. On urban Interstates 8.08% of pavement is in poor condition while in Texas the percentage is 3.43.

In safety and performance categories, California ranks 25th in overall fatality rate, 25th in structurally deficient bridges, 43rd in traffic congestion, 44th in urban Interstate pavement condition, and 40th in rural Interstate pavement condition.

On spending, California spends $206,924 per state-controlled mile of highway. It ranks 44th in total spending per mile and 41st in capital and bridge costs per mile.

California’s best rankings are in structurally deficient bridges (25th) and overall fatality rate (25th).

California’s worst rankings are in urban arterial pavement condition (49th) and maintenance disbursements per mile (47th).

California’s drivers waste 14.75 hours a year in traffic congestion, ranking 43rd in the nation.

California’s state-controlled highway mileage makes it the 9th largest highway system in the country.

“To improve in the report’s overall rankings, California needs its high spending to translate into better system quality. For example, the state is in the bottom 10 in three of the spending categories yet also in the bottom 10 in three of the pavement categories. The state also needs to find a way to decrease its traffic congestion somewhat,” said Baruch Feigenbaum, lead author of the Annual Highway Report and senior managing director of transportation policy at Reason Foundation. “While it may be challenging for California to reduce its spending, if the state could improve its pavement quality to the national average it would move the up in the overall rankings substantially. As it is, the state has the worst of both worlds: high spending and poor roadways.”

Additional Analysis

Compared to nearby states, California’s overall highway performance is worse than Nevada (ranks 20th), Oregon (ranks 25th), and Arizona (ranks 29th).

California ranks behind some comparable states, like Texas (ranks 16th) and ahead of others such as New York (ranks 46th).

While costs in California may be higher than they are in Texas, there is still no reason why the state should spend three times as much per mile. Both states have large geographic areas with urban and rural parts. California may have the larger metro areas, but Texas is growing more rapidly and has a need for additional highways. California is also unique in that it does not rank higher than 25 in any category. Only one other state, Oklahoma, does so poorly in all 13 categories. Even last place New Jersey has high rankings in some of the fatality and pavement quality categories.

California is one of five states to spend more than $40,000 per mile on maintenance costs. New Jersey, Washington, New York, and Rhode Island are the others.

California is one of nine states to spend more than $200,000 per mile on total costs. New Jersey, New York, Massachusetts, Florida, Rhode Island, Maryland, Connecticut, and Washington are the others.

California is one of six states to have more than 20% of their urban arterial pavement condition in poor condition. The others are Rhode Island, Nebraska, Massachusetts, New York, and New Jersey.

Reason Foundation’s Annual Highway Report measures the condition and cost-effectiveness of state-controlled highways in 13 categories, including pavement condition, traffic congestion, structurally deficient bridges, traffic fatalities, and spending (capital, maintenance, administrative, total) per mile.

Policy Study

California Ranks 43rd in the Nation in Highway Performance and Cost-Effectiveness

California’s best rankings are overall fatality rate, structurally deficient bridges, and urban fatality rate.

California’s highway system ranks 43rd in the nation in overall cost-effectiveness and condition, according to the Annual Highway Report by Reason Foundation. This is no change from the previous report, where California also ranked 43rd overall.

In safety and performance categories, California ranks 18th in overall fatality rate, 24th in structurally deficient bridges, 45th in traffic congestion, 44th in urban Interstate pavement condition, and 41st in rural Interstate pavement condition.

On spending, California ranks 42nd in total spending per mile and 40th in capital and bridge costs per mile.

“To improve in the rankings, California needs to improve its pavement conditions, reduce its urban area congestion, lower its maintenance and administrative disbursements per mile, and reduce its rural fatality rate. California is in the bottom 10 of all states in six of the 13 total metrics. Compared to neighboring states, the report finds California’s overall highway performance is worse than Arizona (ranks 23rd), Nevada (ranks 27th), and Oregon (ranks 28th),” said Baruch Feigenbaum, lead author of the Annual Highway Report and senior managing director of transportation policy at Reason Foundation. “California is doing better than some comparable states such as New York (ranks 44th) but worse than others like Texas (18th).”

California’s best rankings are in overall fatality rate (18th) and structurally deficient bridges (24th).

California’s worst rankings are in urban arterial pavement condition (48th) and administrative disbursements per mile (47th).

California’s state-controlled highway mileage makes it the 17th largest highway system in the country.

Reason Foundation’s Annual Highway Report measures the condition and cost-effectiveness of state-controlled highways in 13 categories, including pavement condition, traffic congestion, structurally deficient bridges, traffic fatalities, and spending (capital, maintenance, administrative, overall) per mile.

Reason Foundation’s Annual Highway Report measures the condition and cost-effectiveness of state-controlled highways in 13 categories, including pavement condition, traffic congestion, structurally deficient bridges, traffic fatalities, and spending (capital, maintenance, administrative, overall) per mile.

The Annual Highway Report is based on spending and performance data submitted by state highway agencies to the federal government for 2018 as well as urban congestion data from INRIX and bridge condition data from the Better Roads inventory for 2019.

Policy Study

California Ranks 43rd in the Nation in Highway Performance and Cost-Effectiveness

California’s best rankings are overall fatality rate, structurally deficient bridges and urban fatality rate.

California’s highway system ranks 43rd in the nation in overall cost-effectiveness and condition, according to the Annual Highway Report by Reason Foundation. This is a one-spot decrease from the previous report, where California ranked 42nd overall.

In safety and performance categories, California ranks 18th in overall fatality rate, 19th in structurally deficient bridges, 48th in traffic congestion, 47th in urban Interstate pavement condition and 45th in rural Interstate pavement condition.

On spending, California ranks 40th in total spending per mile and 30th in capital and bridge costs per mile.

“To improve in the rankings, California needs to improve its pavement conditions, reduce its urban area congestion, lower its maintenance and administrative disbursements per mile, and reduce its rural fatality rate. California is in the bottom 10 of all states in seven of the 13 total metrics. Compared to neighboring states, the report finds California’s overall highway performance is worse than Arizona (ranks 29th), Nevada (ranks 27th) and Oregon (ranks 12th),” said Baruch Feigenbaum, lead author of the Annual Highway Report and assistant director of transportation at Reason Foundation.

California’s best rankings are in overall fatality rate (18th) and structurally deficient bridges (19th).

California’s worst rankings are in urban arterial pavement condition (49th) and urban area congestion (48th).

California’s state-controlled highway mileage makes it the 15th largest highway system in the country.

The Annual Highway Report is based on spending and performance data submitted by state highway agencies to the federal government for 2016 as well as urban congestion data from INRIX and bridge condition data from the Better Roads inventory for 2017. For more details on the calculation of each of the 13 performance measures used in the report, as well as the overall performance measure, please refer to the appendix in the main report. The report’s dataset includes Interstate, federal and state roads but not county or local roads. All rankings are based on performance measures that are ratios rather than absolute values: the financial measures are disbursements per mile, the fatality rate is fatalities per 100 million vehicle-miles of travel, the urban congestion measure is the annual delay per auto commuter, and the others are percentages. For example, the state ranking 1st in structurally deficient bridges has the smallest percentage of structurally deficient bridges, not the smallest number of structurally deficient bridges.


Policy Study

California Ranks 42nd Overall in Highway Performance and Cost-Effectiveness

California’s best rankings are rural arterial lane-width (1st), fatality rate (14th), and deficient bridges (28th).

California ranks 42nd in the nation in highway performance and cost-effectiveness in the Annual Highway Report by Reason Foundation.

California ranks 14th in fatality rate, 28th in deficient bridges, 33rd in rural Interstate pavement condition, 46th in urban Interstate pavement condition, and 49th in urbanized area congestion.

On spending, California ranks 43rd in total disbursements per mile and 46th in administrative disbursements per mile.

California’s best rankings are rural arterial lane-width (1st), fatality rate (14th), and deficient bridges (28th).

California’s worst rankings are urbanized area congestion (49th) and maintenance disbursements per mile (47th).

California’s state-controlled highway mileage makes it the 15th largest system.