


Reason Foundation’s Annual Highway Report has tracked the performance of the 50 state-owned highway systems from 1984 to 2022. The 28th Annual Highway Report ranks the performance of state highway systems using 2022 data.
Each state’s overall rating is determined by rankings in 13 categories, including highway expenditures per mile, Interstate and primary road pavement conditions, urbanized area congestion, bridge conditions, and fatality rates.
The study is based on spending and performance data state highway agencies submitted to the federal government, supplemented by data from the National Bridge Inventory, INRIX, and the American Community Survey. This study also reviews changes in highway performance over the past year.
Although individual state highway sections (roads, bridges, pavements) deteriorate over time due to age, traffic, and weather, states perform maintenance to keep infrastructure in a state of good repair. They also reconstruct roadways when necessary. As a result, system performance can improve even as individual roads and bridges worsen. Table ES1 summarizes recent system trends for key indicators. The U.S. saw system improvements in some categories from 2020 to 2022, but declines in several other categories.
Between 2020 and 2022, three of the four disbursement measures (Capital and Bridge, Maintenance, and Administrative) for the U.S. state-owned highway system increased (states spent more money on their highway systems in 2022 than in 2020). The other disbursement measure (Other) decreased from the previous report. And when factoring inflation into account, spending has been roughly consistent over all categories during the past five years.
Further, six of the nine performance measures improved, including Rural Interstate Pavement Condition, Urban Interstate Pavement Condition, Rural Other Arterial Pavement Condition, Urban Other Arterial Pavement Condition, Rural Fatality Rate, and Structurally Deficient Bridges (a smaller percentage of bridges is structurally deficient).
Three of the nine performance measures worsened: Urbanized Area Congestion, Urban Fatality Rate, and Other Fatality Rate.
Overall, when adjusting for inflation, states are spending about the same amount of money for a slightly better quality roadway system.
28th Annual Highway Report: Table ES1: Performance of State-Owned Highway Systems, 2019-2022
| Statistic | 2019 | 2020 | 2022 | Percent change 2020-2022 | Percent change 2019-2022 |
|---|---|---|---|---|---|
| Mileage Under State Control (Thousands) | 781 | 868 | 782 | -9.91% | 0.13% |
| Disbursements per Lane-Mile, Capital/Bridges, $ | $41,850 | $41,783 | $43,674 | 4.53% | 4.36% |
| Disbursements per Lane-Mile, Maintenance, $ | $14,570 | $14,546 | $14,819 | 1.88% | 1.71% |
| Disbursements per Lane-Mile, Administration, $ | $5,351 | $5,432 | $6,308 | 16.13% | 17.88% |
| Disbursements per Lane-Mile, Other $ | N/A | $21,908 | $20,430 | -6.75% | N/A |
| Consumer Price Index (1983=$1.00) | $2.57 | $2.64 | $2.87 | 8.71% | 11.67% |
| Rural Interstate, Percent Poor Condition | 2 | 2.09 | 2.03 | -2.87% | 1.50% |
| Urban Interstate, Percent Poor Condition | 4.97 | 4.77 | 4.55 | -4.61% | -8.45% |
| Rural Other Principal Arterial, Percent Poor Condition | 1.15 | 1.13 | 1 | -11.50% | -13.04% |
| Urban Other Principal Arterial, Percent Poor Condition | 13.52 | 14.19 | 12.95 | -8.74% | -4.22% |
| Urbanized Area Congestion | 23.83 | 21.93 | 41.33 | 88.46% | 73.44% |
| Structurally Deficient Bridges, Poor Condition | 7.46 | 7.02 | 6.9 | -1.71% | -7.51% |
| Rural Fatality Rate per 100 Million Vehicle-Miles, All Arterials | 1.26 | 1.3 | 1.25 | -3.85% | -0.79% |
| Urban Fatality Rate per 100 Million Vehicle-Miles, All Arterials | 0.82 | 1.04 | 1.07 | 2.88% | 30.49% |
| Other Fatality Rate per 100 Million Vehicle-Miles | N/A | 1.54 | 1.56 | 1.30% | N/A |
Table ES2 summarizes system trends over the past 10 years.
Over a 10-year period disbursements increased, pavement quality worsened, congestion improved (on a statewide basis), the percentage of structurally deficient bridges decreased, and the fatality rate held steady. The worsening urban Interstate quality and rural arterial pavement quality are a change from the previous 10-year period. Figure ES1 displays this information in a graph.
28th Annual Highway Report: Table ES2: Trends in Highway System Performance, 2011-2022
| Statistic | 2011 | 2012 | 2013 | 2014 | 2015 | 2016 | 2017 | 2018 | 2019 | 2020 | 2022 |
|---|---|---|---|---|---|---|---|---|---|---|---|
| Mileage Under State Control (Thousands) | 814 | 814 | 815 | 817 | 814 | 837 | N/A | 857 | 781 | 868 | 782 |
| Other Disbursements per Lane-Mile, $ | N/A | N/A | N/A | N/A | N/A | N/A | N/A | N/A | N/A | $21,908 | $20,430 |
| Disbursements per Lane-Mile, Capital/Bridges, $ | $81,844* | $86,153* | $84,494* | $90,969* | $91,992* | $36,681 | N/A | $46,805 | $41,850 | $41,783 | $43,674 |
| Disbursements per Lane-Mile, Maintenance, $ | $25,129* | $26,079* | $25,996* | $27,559* | $28,020* | $11,929 | N/A | $15,952 | $14,570 | $14,546 | $14,819 |
| Disbursements per Lane-Mile, Administration, $ | $10,430* | $10,579* | $10,051* | $ 9,980* | $10,864* | $4,501 | N/A | $6,443 | $5,351 | $5,432 | $6,308 |
| Consumer Price Index (1983=1.00) | $2.25 | $2.32 | $2.35 | $2.39 | $2.39 | $2.42 | $2.48 | $2.53 | $2.57 | $2.64 | $2.87 |
| Rural Interstate, Percent Poor Condition | 1.78* | 1.78* | 2.00* | 2.11* | 1.85* | 1.96 | N/A | 1.89 | 2 | 2.09 | 2.03 |
| Urban Interstate, Percent Poor Condition | 5.18* | 4.97* | 5.37* | 5.22* | 5.02* | 5.18 | N/A | 5.1 | 4.97 | 4.77 | 4.55 |
| Rural Other Principal Arterial, Percent Poor Condition | 0.77* | 0.89* | 1.27* | 1.20* | 1.35* | 1.36 | N/A | 2.59 | 1.15 | 1.13 | 1 |
| Urban Other Principal Arterial, Percent Poor Condition | N/A | N/A | N/A | N/A | N/A | 13.97 | N/A | 12.06 | 13.52 | 14.19 | 12.95 |
| Urbanized Area Congestion | 42.15** | N/A | 40.99** | 51.40** | 34.95** | N/A | 34.7 | 33.43 | 23.83** | 21.93** | 41.33 |
| Structurally Deficient Bridges, Poor Condition | N/A | N/A | N/A | N/A | 9.60* | 9.1 | 8.86 | 7.94 | 7.46 | 7.02 | 6.9 |
| Other Fatality Rate per 100 Million Vehicle-Miles | N/A | N/A | N/A | N/A | N/A | N/A | N/A | N/A | N/A | 1.54 | 1.56 |
| Rural Fatality Rate per 100 Million Vehicle-Miles, All Arterials | N/A | N/A | N/A | 1.30* | 1.58* | 1.71 | N/A | 1.42 | 1.26 | 1.3 | 1.25 |
| Urban Fatality Rate per 100 Million Vehicle-Miles, All Arterials | N/A | N/A | N/A | 0.67* | 0.70* | 0.77 | N/A | 0.78 | 0.82 | 1.04 | 1.07 |
Figure ES1: Trends in Highway System Performance
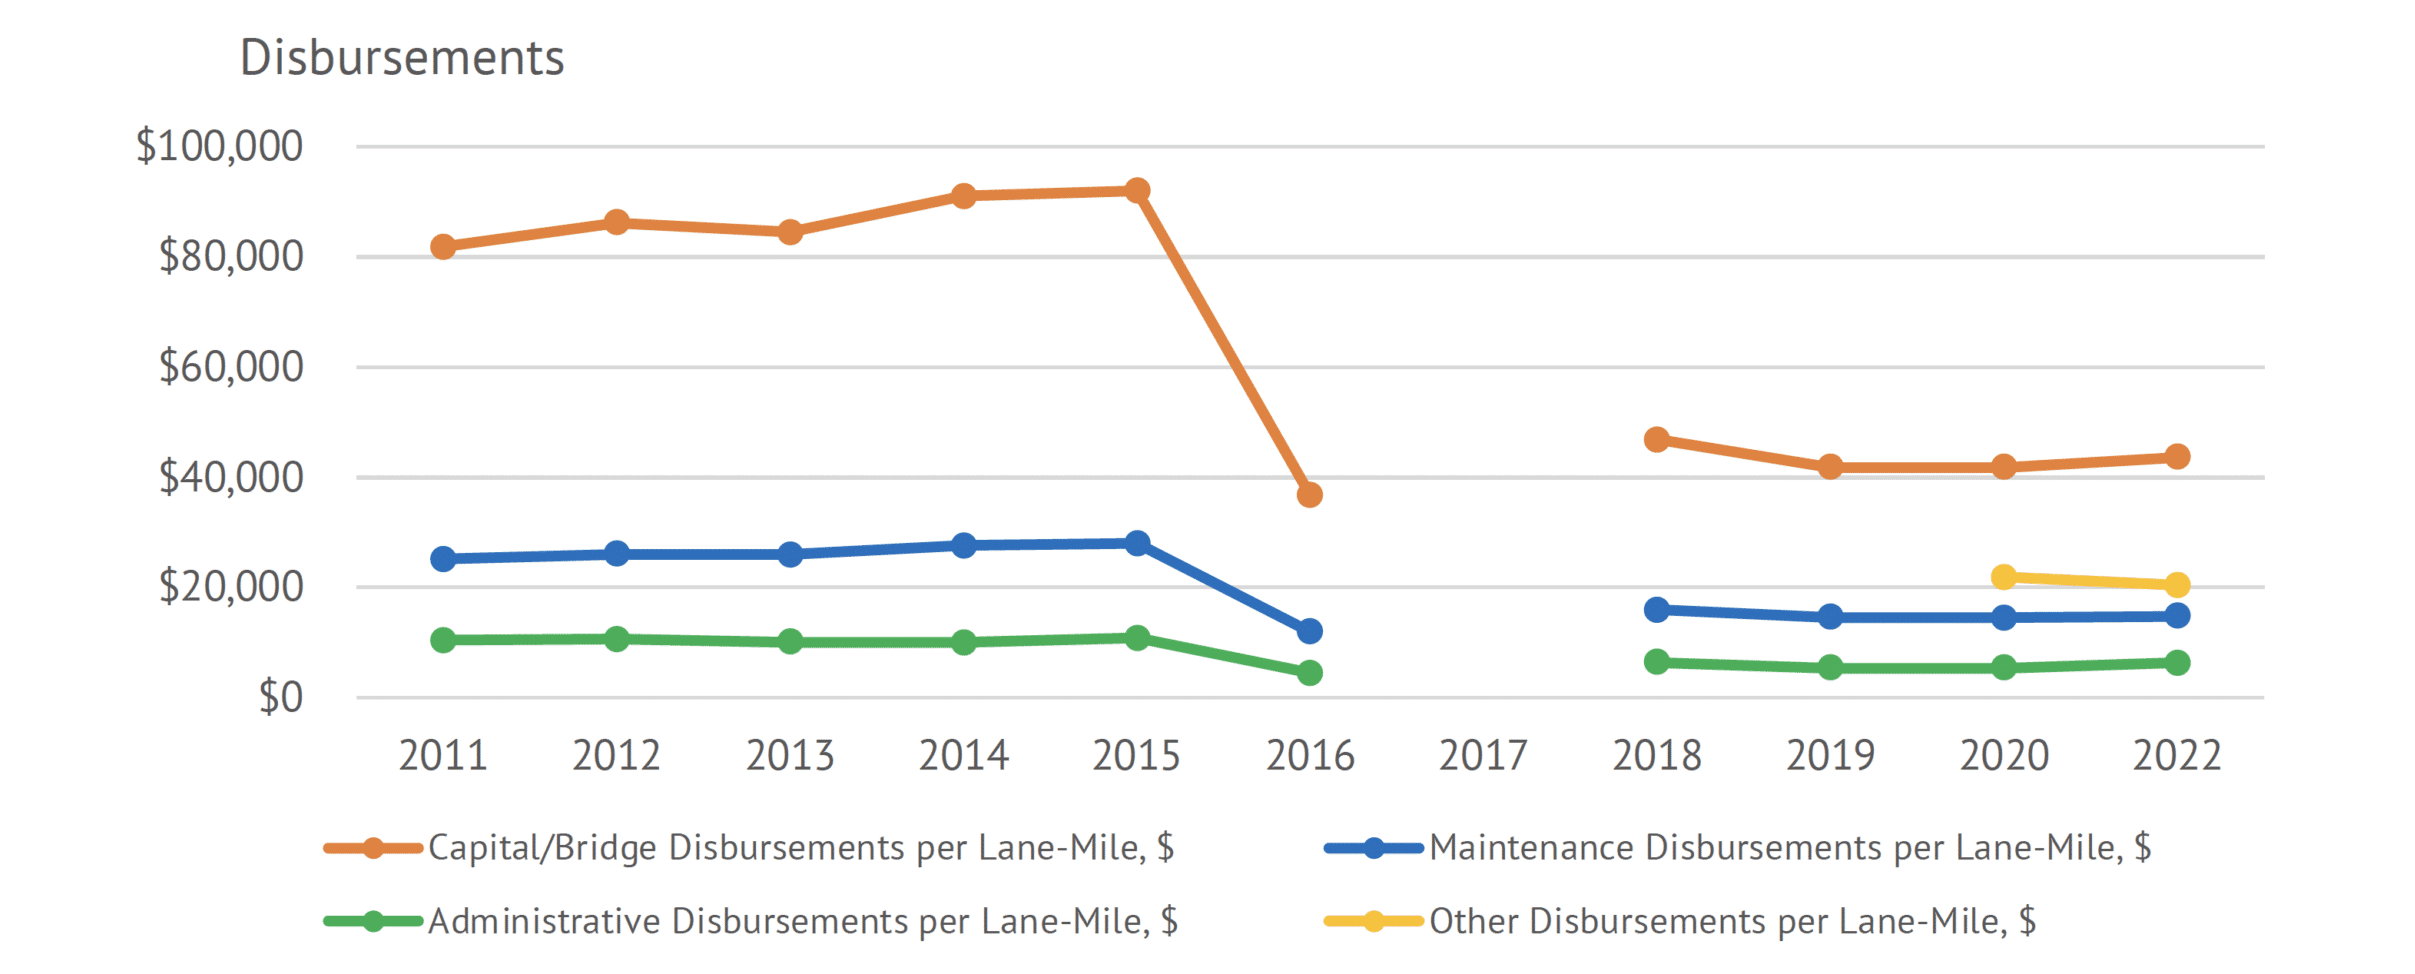
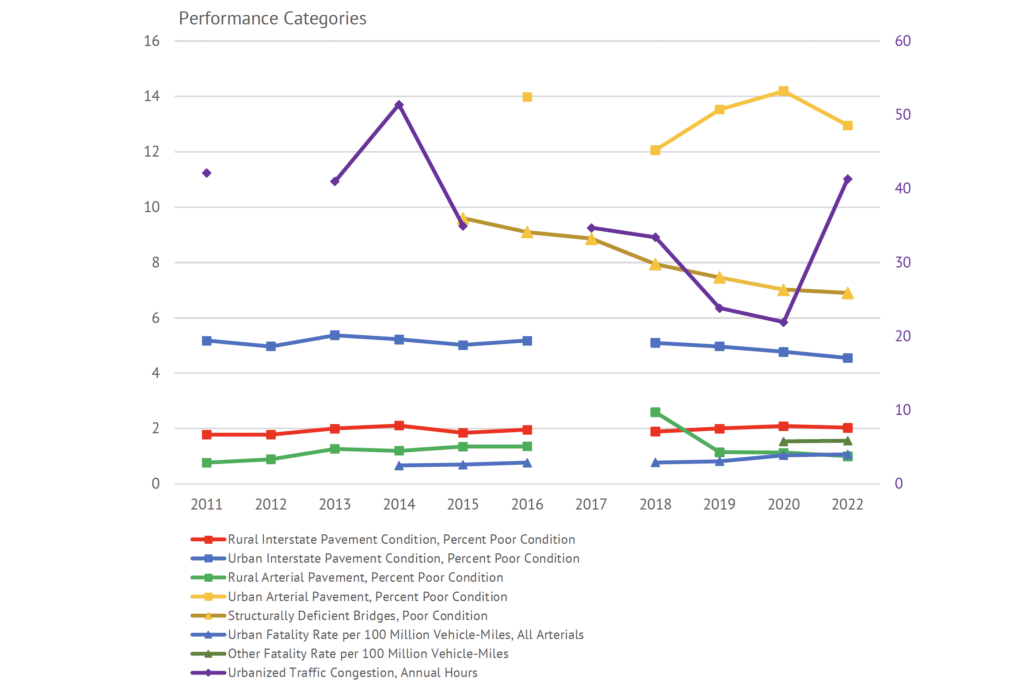
Figure ES2 shows each state’s ranking based on 2022 data. The top-performing states tend to be a mix of high-population and low-population states that lean both urban and rural.
Very rural, low-population states may have had a slight advantage before 2019. But since the report changed to using expected disbursements and ratios, that advantage no longer exists. For example, while North Dakota often leads the rankings, this year North Carolina ranked first followed by South Carolina, North Dakota, Virginia and Tennessee.
At the other end of the rankings are Alaska, California, Hawaii, Washington, and Louisiana. Two of the five worst performing states rank in the bottom 11 in population.
A number of states with large populations and/or large metro areas fared well: North Carolina (1st), Virginia (4th), Tennessee (5th), Georgia (6th), and Ohio (10th).
Some states had large increases or decreases in their ratings. The rankings for Idaho, Maine, and New Jersey improved by at least 10 spots.
However, the rankings for Massachusetts and Arkansas worsened by at least 10 spots.
Certain states spend significantly more than the national average. This spending may be justified if these states perform well in other categories. While some states’ disbursements have improved their deficiencies, other states are still performing badly:
- For Capital and Bridge Disbursements, five states have per-mile ratios higher than
1.5: Washington, Idaho, Alaska, Utah, and Indiana. - For Maintenance Disbursements, 11 states have per-mile ratios higher than 1.5: Washington, Indiana, Vermont, Oregon, Delaware, Colorado, California, Oklahoma, New York, Massachusetts, and Alaska.
- For Administrative Disbursements, six states have per-mile ratios higher than 2.0: Vermont, Nevada, Delaware, Washington, New Hampshire, and South Dakota.
- For Other Disbursements, three states have per-mile ratios higher than 2.0: Washington, Kansas, and Vermont.
System performance problems in each measured category seem to be concentrated in a handful of states:
- More than 25% of the rural Interstate mileage in poor condition is in just three states: Alaska, Colorado, and California.
- More than 30% of the urban Interstate mileage in poor condition is in just six states: Hawaii, Louisiana, New York, California, Delaware, and Colorado.
- Approximately 13% of the rural arterial mileage in poor condition is in just three states: Alaska, Rhode Island, and Vermont.
- Approximately 40% of the urban arterial primary mileage in poor condition is in just five states: California, Nebraska, Rhode Island, New York, and Massachusetts.
- Automobile commuters in seven states spend more than 60 hours annually stuck in peak-hour traffic congestion: New Jersey, Massachusetts, Delaware, New York, Illinois, Maryland, and California.
- Although a majority of states saw the percentage of structurally deficient bridges decline, nine states report more than 10% of their bridges as structurally deficient: West Virginia, Iowa, South Dakota, Rhode Island, Maine, Pennsylvania, Louisiana, Michigan, and North Dakota.
- Three states have rural fatality rates of 2.0 per 100 million vehicle-miles traveled or higher: Hawaii, Delaware, and Alaska.
- Urban fatality rates continue to worsen as 27 states have urban fatality rates of 1.0 per 100 million vehicle-miles traveled or higher: New Mexico, Alaska, Florida, Hawaii, Arkansas, Indiana, Montana, Tennessee, Mississippi, South Carolina, Colorado, Georgia, Arizona, Louisiana, Delaware, Oregon, Texas, California, Missouri, Nebraska, Oklahoma, Alabama, Maryland, Washington, Connecticut, Nevada, and Michigan.
- Other fatality rates continue to worsen as 25 states have other fatality rates of 1.5 per 100 million vehicle-miles traveled or higher: West Virginia, Oklahoma, South Carolina, Kentucky, Louisiana, California, Oregon, Texas, Tennessee, Arizona, South Dakota, North Carolina, Delaware, Nevada, Arkansas, Kansas, New Mexico, Washington, Colorado, Ohio, Mississippi, Georgia, Illinois, Florida, and Alabama.
System performance improved for some states but declined for others this year, with slightly less than half of the states (21 of 50) making progress between 2020 and 2022. However, a 10-year average of state overall performance data indicates that system performance problems are concentrated in a handful of states. These states are finding it difficult to improve. There is also increasing evidence that higher-level highway systems (Interstates, other freeways, and principal arterials) are in better shape than lower-level highway systems, particularly local roads.
28th Annual Highway Report: Each State’s Highway Performance Ranking By Category
| State | Overall | Capital & Bridge Disbursements Ratio | Maintenance Disbursements Ratio | Admin Disbursements Ratio | Other Disbursements Ratio | Rural Interstate Pavement Condition | Urban Interstate Pavement Condition | Rural Arterial Pavement Condition | Urban Arterial Pavement Condition | Urbanized Area Congestion | Structurally Deficient Bridges | Rural Fatality Rate | Urban Fatality Rate | Other Fatality Rate |
|---|---|---|---|---|---|---|---|---|---|---|---|---|---|---|
| North Carolina | 1 | 7 | 5 | 1 | 3 | 20 | 17 | 15 | 10 | 21 | 31 | 39 | 9 | 39 |
| South Carolina | 2 | 2 | 4 | 6 | 1 | 27 | 10 | 22 | 7 | 23 | 18 | 44 | 41 | 48 |
| North Dakota | 3 | 26 | 14 | 15 | 11 | 6 | 3 | 20 | 25 | 1 | 42 | 29 | 6 | 7 |
| Virginia | 4 | 1 | 29 | 12 | 5 | 11 | 26 | 8 | 17 | 37 | 9 | 35 | 23 | 16 |
| Tennessee | 5 | 11 | 13 | 28 | 2 | 19 | 16 | 18 | 9 | 27 | 11 | 27 | 43 | 42 |
| Georgia | 6 | 8 | 15 | 32 | 22 | 14 | 13 | 2 | 3 | 43 | 5 | 25 | 39 | 29 |
| Minnesota | 7 | 29 | 36 | 36 | 36 | 8 | 14 | 17 | 2 | 29 | 12 | 2 | 1 | 6 |
| Utah | 8 | 47 | 34 | 27 | 32 | 10 | 18 | 10 | 6 | 16 | 6 | 10 | 17 | 9 |
| Missouri | 9 | 3 | 11 | 5 | 27 | 18 | 23 | 14 | 22 | 20 | 39 | 26 | 32 | 17 |
| Ohio | 10 | 6 | 20 | 18 | 26 | 26 | 32 | 9 | 36 | 14 | 13 | 9 | 12 | 31 |
| Kentucky | 11 | 15 | 17 | 2 | 31 | 24 | 30 | 7 | 14 | 22 | 33 | 17 | 22 | 47 |
| Wyoming | 12 | 23 | 27 | 9 | 8 | 21 | 42 | 6 | 18 | 8 | 29 | 36 | 14 | 22 |
| Connecticut | 13 | 18 | 9 | 14 | 20 | 9 | 15 | 32 | 28 | 32 | 21 | 30 | 26 | 21 |
| Florida | 14 | 40 | 25 | 23 | 23 | 4 | 9 | 5 | 5 | 39 | 10 | 38 | 48 | 27 |
| Idaho | 15 | 49 | 33 | 17 | 40 | 23 | 7 | 12 | 12 | 7 | 20 | 23 | 5 | 15 |
| Montana | 16 | 16 | 38 | 19 | 25 | 13 | 2 | 24 | 27 | 18 | 32 | 41 | 44 | 24 |
| Alabama | 17 | 22 | 1 | 42 | 46 | 33 | 29 | 4 | 1 | 17 | 8 | 33 | 29 | 26 |
| Mississippi | 18 | 13 | 2 | 8 | 9 | 32 | 35 | 38 | 32 | 6 | 28 | 40 | 42 | 30 |
| New Hampshire | 19 | 9 | 28 | 46 | 44 | 2 | 1 | 19 | 8 | 33 | 34 | 19 | 3 | 20 |
| Indiana | 20 | 46 | 49 | 16 | 6 | 34 | 22 | 3 | 4 | 28 | 24 | 14 | 45 | 5 |
| Maine | 21 | 21 | 35 | 11 | 24 | 3 | 6 | 44 | 29 | 2 | 46 | 15 | 4 | 23 |
| Kansas | 22 | 38 | 23 | 34 | 49 | 15 | 21 | 13 | 21 | 5 | 22 | 11 | 19 | 35 |
| Michigan | 23 | 33 | 22 | 13 | 15 | 38 | 41 | 16 | 33 | 26 | 43 | 3 | 24 | 19 |
| Nevada | 24 | 36 | 26 | 49 | 34 | 5 | 20 | 1 | 11 | 35 | 3 | 47 | 25 | 37 |
| Texas | 25 | 32 | 18 | 38 | 19 | 22 | 34 | 11 | 38 | 40 | 2 | 37 | 34 | 43 |
| Wisconsin | 26 | 24 | 10 | 24 | 39 | 30 | 33 | 39 | 44 | 24 | 27 | 7 | 10 | 10 |
| South Dakota | 27 | 31 | 39 | 45 | 12 | 7 | 11 | 23 | 15 | 11 | 48 | 21 | 15 | 40 |
| Arkansas | 28 | 25 | 6 | 3 | 21 | 39 | 40 | 36 | 30 | 4 | 23 | 43 | 46 | 36 |
| Arizona | 29 | 27 | 7 | 41 | 30 | 41 | 12 | 30 | 20 | 30 | 1 | 45 | 38 | 41 |
| Nebraska | 30 | 28 | 32 | 29 | 16 | 16 | 25 | 35 | 49 | 15 | 36 | 20 | 31 | 12 |
| Iowa | 31 | 44 | 21 | 33 | 17 | 28 | 24 | 40 | 26 | 3 | 49 | 6 | 11 | 18 |
| Maryland | 32 | 19 | 31 | 22 | 47 | 25 | 44 | 27 | 45 | 45 | 14 | 1 | 28 | 11 |
| West Virginia | 33 | 5 | 12 | 7 | 4 | 35 | 31 | 45 | 13 | 10 | 50 | 34 | 13 | 50 |
| New Jersey | 34 | 39 | 16 | 10 | 38 | 12 | 43 | 29 | 41 | 50 | 30 | 5 | 16 | 8 |
| Oregon | 35 | 34 | 47 | 39 | 37 | 17 | 19 | 26 | 23 | 41 | 15 | 46 | 35 | 44 |
| Illinois | 36 | 45 | 24 | 30 | 29 | 29 | 37 | 42 | 34 | 46 | 38 | 16 | 21 | 28 |
| Pennsylvania | 37 | 17 | 37 | 31 | 33 | 37 | 39 | 31 | 37 | 42 | 45 | 12 | 20 | 25 |
| New Mexico | 38 | 10 | 3 | 44 | 35 | 40 | 36 | 34 | 39 | 25 | 16 | 42 | 50 | 34 |
| Oklahoma | 39 | 37 | 43 | 37 | 42 | 36 | 38 | 43 | 31 | 12 | 41 | 22 | 30 | 49 |
| Massachusetts | 40 | 12 | 41 | 43 | 18 | 43 | 28 | 33 | 46 | 49 | 37 | 24 | 8 | 4 |
| Delaware | 41 | 4 | 46 | 48 | 10 | – | 46 | 21 | 16 | 48 | 4 | 49 | 36 | 38 |
| Rhode Island | 42 | 30 | 30 | 20 | 7 | 1 | 4 | 49 | 48 | 38 | 47 | 31 | 2 | 2 |
| Colorado | 43 | 42 | 45 | 26 | 13 | 47 | 45 | 37 | 35 | 36 | 19 | 32 | 40 | 32 |
| Vermont | 44 | 35 | 48 | 50 | 48 | 31 | 5 | 48 | 24 | 9 | 7 | 8 | 7 | 14 |
| New York | 45 | 41 | 42 | 40 | 41 | 42 | 48 | 28 | 47 | 47 | 40 | 4 | 18 | 13 |
| Louisiana | 46 | 14 | 19 | 4 | 45 | 45 | 49 | 46 | 42 | 34 | 44 | 13 | 37 | 46 |
| Washington | 47 | 50 | 50 | 47 | 50 | 44 | 27 | 25 | 43 | 31 | 17 | 18 | 27 | 33 |
| Hawaii | 48 | 20 | 8 | 25 | 14 | – | 50 | 47 | 40 | 19 | 26 | 50 | 47 | 1 |
| California | 49 | 43 | 44 | 35 | 43 | 46 | 47 | 41 | 50 | 44 | 25 | 28 | 33 | 45 |
| Alaska | 50 | 48 | 40 | 21 | 28 | 48 | 8 | 50 | 19 | 13 | 35 | 48 | 49 | 3 |