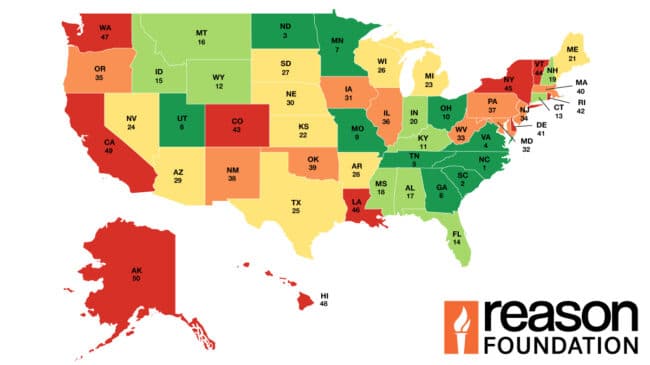


The other fatality rate measures fatalities on rural and urban minor arterials, collectors, and local roadways in the state as fatalities per 100 million vehicle-miles. The nation’s average other fatality rate increased between 2020 and 2022 from 1.54 to 1.56, (Table 17, Other Fatality Rate per 100 Million Vehicle-Miles, 2022, Figure 14). In 2022, 22,098 fatalities were reported, more than the 20,193 fatalities reported in 2020, as VMT (vehicle-miles of travel) decreased due to COVID-19.
For 2022, Hawaii reported the lowest other fatality rate, 0.62, while West Virginia reported the highest, 2.36. Twenty-two states saw their fatality rates decrease, led by Mississippi (0.61 points) and Rhode Island (0.53 points). Twenty-four states reported an increase to their other fatality rates compared to 2020, led by Nevada and Arkansas (which worsened by 0.62 and 0.59 points respectively).
28th Annual Highway Report: Other Highway Fatality Rate (Per 100 Million Vehicle-Miles Traveled)
| 2022 Rank | State | Fatality Rate Per 100 Million Vehicle-Miles |
|---|---|---|
| 1 | Hawaii | 0.62 |
| 2 | Rhode Island | 0.68 |
| 3 | Alaska | 0.73 |
| 4 | Massachusetts | 0.81 |
| 5 | Indiana | 0.88 |
| 6 | Minnesota | 0.99 |
| 7 | North Dakota | 1 |
| 8 | New Jersey | 1.03 |
| 9 | Utah | 1.06 |
| 10 | Wisconsin | 1.07 |
| 11 | Maryland | 1.1 |
| 12 | Nebraska | 1.21 |
| 13 | New York | 1.25 |
| 14 | Vermont | 1.31 |
| 15 | Idaho | 1.32 |
| 16 | Virginia | 1.34 |
| 17 | Missouri | 1.38 |
| 18 | Iowa | 1.39 |
| 19 | Michigan | 1.45 |
| 20 | New Hampshire | 1.45 |
| 21 | Connecticut | 1.46 |
| 22 | Wyoming | 1.47 |
| 22 | Maine | 1.47 |
| 24 | Montana | 1.48 |
| 25 | Pennsylvania | 1.49 |
| 26 | Alabama | 1.51 |
| 27 | Florida | 1.52 |
| 28 | Illinois | 1.52 |
| 29 | Georgia | 1.54 |
| 30 | Mississippi | 1.55 |
| 31 | Ohio | 1.56 |
| 32 | Colorado | 1.57 |
| 33 | Washington | 1.59 |
| 34 | New Mexico | 1.65 |
| 34 | Kansas | 1.69 |
| 36 | Arkansas | 1.7 |
| 37 | Nevada | 1.72 |
| 38 | Delaware | 1.72 |
| 39 | North Carolina | 1.73 |
| 40 | South Dakota | 1.74 |
| 41 | Arizona | 1.83 |
| 42 | Tennessee | 1.88 |
| 43 | Texas | 1.92 |
| 44 | Oregon | 1.92 |
| 45 | California | 1.99 |
| 46 | Louisiana | 2.11 |
| 47 | Kentucky | 2.17 |
| 48 | South Carolina | 2.24 |
| 49 | Oklahoma | 2.27 |
| 50 | West Virginia | 2.36 |
| Average | 1.56 |