


Federal law mandates the uniform inspection of all bridges for structural adequacy at least every two years; bridges rated “deficient” are eligible for federal repair dollars. The National Bridge Inventory (NBI) is the source of the bridge data in the table and figure following, which is provided in summary form in Better Roads (see Appendix). Since the NBI contains some recent inspections and some as old as two years, the age of the “average” inspection is about one year old. So, a “December 2023” summary from the NBI would represent, on average, bridge condition as of December 2022.
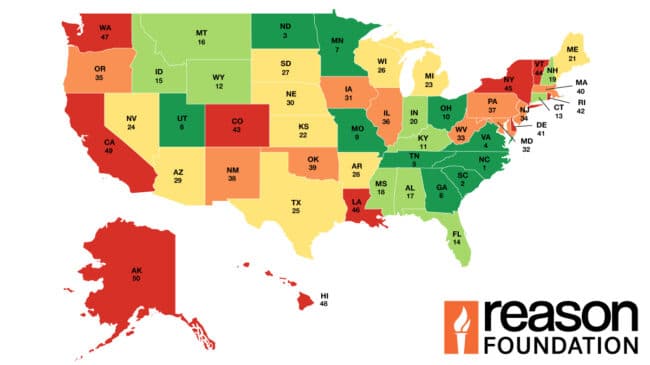
The condition of the nation’s highway bridges in 2022 improved slightly from 2021, the last time this assessment was completed. Of the 618,005 highway bridges reported, 42,635 (6.9%) were rated structurally deficient for 2022 (Table 16, Percent of Structurally Deficient Bridges, 2022, Figure 11). This represents a 0.12% improvement over 2021 when (7.02%) were rated as structurally deficient.
Arizona, Texas, Nevada, Delaware, and Georgia reported less than 2% of their bridges as structurally deficient (1.26%, 1.39%, 1.40%, 1.61%, and 1.95% respectively). On the other hand West Virginia (19.97%), Iowa (19.32%), South Dakota (16.89%), Rhode Island (16.58%), and Maine (14.17%) all have more than 14% of their bridges as structurally deficient. All states reported a decrease in the percentage of structurally deficient bridges between 2021 and 2022, with Arizona and Texas seeing the smallest decrease (1.06 and 1.18 percentage points, respectively) and West Virgina, Iowa, and South Dakota seeing the largest decrease (17.06, 16.67, and 14.42 respectively).
28th Annual Highway Report: Percent Structurally Deficient Bridges, 2022
| State | 2022 Rank | Percent Structurally Deficient Bridges |
|---|---|---|
| Arizona | 1 | 1.26 |
| Texas | 2 | 1.39 |
| Nevada | 3 | 1.4 |
| Delaware | 4 | 1.61 |
| Georgia | 5 | 1.95 |
| Utah | 6 | 2.08 |
| Vermont | 7 | 2.49 |
| Alabama | 8 | 3.56 |
| Virginia | 9 | 3.57 |
| Florida | 10 | 3.57 |
| Tennessee | 11 | 4.32 |
| Minnesota | 12 | 4.46 |
| Ohio | 13 | 4.53 |
| Maryland | 14 | 4.6 |
| Oregon | 15 | 4.8 |
| New Mexico | 16 | 4.93 |
| Washington | 17 | 5.04 |
| South Carolina | 18 | 5.06 |
| Colorado | 19 | 5.07 |
| Idaho | 20 | 5.11 |
| Connecticut | 21 | 5.17 |
| Kansas | 22 | 5.19 |
| Arkansas | 23 | 5.2 |
| Indiana | 24 | 5.37 |
| California | 25 | 5.99 |
| Hawaii | 26 | 6.29 |
| Wisconsin | 27 | 6.43 |
| Mississippi | 28 | 6.54 |
| Wyoming | 29 | 6.57 |
| New Jersey | 30 | 6.69 |
| North Carolina | 31 | 6.92 |
| Montana | 32 | 6.95 |
| Kentucky | 33 | 6.99 |
| New Hampshire | 34 | 7.51 |
| Alaska | 35 | 7.75 |
| Nebraska | 36 | 7.96 |
| Massachusetts | 37 | 8.45 |
| Illinois | 38 | 9.02 |
| Missouri | 39 | 9.08 |
| New York | 40 | 9.18 |
| Oklahoma | 41 | 9.51 |
| North Dakota | 42 | 10.49 |
| Michigan | 43 | 11.22 |
| Louisiana | 44 | 12.34 |
| Pennsylvania | 45 | 13.41 |
| Maine | 46 | 14.17 |
| Rhode Island | 47 | 16.58 |
| South Dakota | 48 | 16.89 |
| Iowa | 49 | 19.32 |
| West Virginia | 50 | 19.97 |
| Average | 6.9 |