


There is no universally accepted definition of traffic congestion. In reporting to the federal government, the states have in the past used peak-hour traffic volume-to- capacity (V/C) ratios, as calculated in the Transportation Research Board’s Highway Capacity Manual, as a congestion measure. Through 2009, the Federal Highway Administration (FHWA) summed these V/C calculations to determine the state mileage in various V/C categories. Since 2009, however, these tables have not been published by FHWA. Instead, FHWA has been reporting periodic statistics based on travel delays from mobile devices, but only for selected regions and roads, not for states.
This year, the Annual Highway Report uses data from INRIX’s 2023 Global Traffic Scorecard, which uses 2022 congestion data. The metric selected was the “annual hours of delay per auto commuter.” INRIX defines annual delay per auto commuter as “a measure of the extra travel time endured throughout the year by auto commuters who make trips during the peak period.” The INRIX data, which are computed for urbanized areas, are aggregated by state.
See the Appendix for details
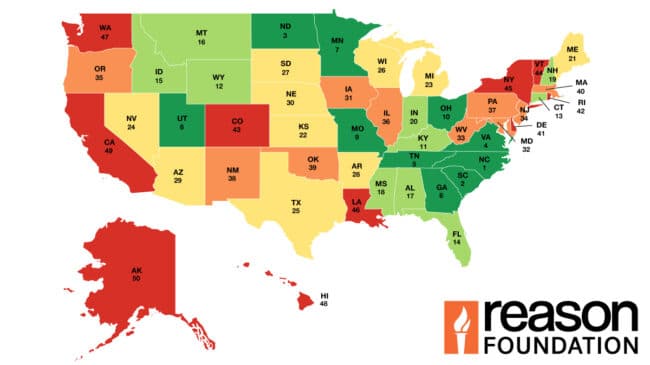
In 2022, the average annual hours of delay per auto commuter in urbanized areas was
41.33 hours (see Table 15, Annual Hours of Delay per Auto Commuter, Figure 10). Annual hours of delay range from 4.23 in North Dakota to 103.92 in New Jersey. The congestion problem is primarily concentrated in the major cities of about 10 states.
In 2022, commuters in 11 states spent fewer than 10 hours of delay sitting in peak-hour congestion. Commuters in the top five states (North Dakota, Maine, Iowa, Arkansas, Kansas) spent less than seven and a half hours of delay per year in traffic congestion. Commuters in 37 other states spent less than 40 hours of delay sitting in peak-hour congestion. Commuters in the bottom three states (Delaware, Massachusetts, New Jersey) spent more than 80 hours of delay per year in traffic congestion. Dramatic rises in congestion can be attributed to commuters returning to the office after COVID-19, additional midday and weekend traffic, and the limited number of roadway widenings.
28th Annual Highway Report: Urbanized Area Traffic Congestion — Annual Peak Hours Spent in Congestion Per Commuter
| State | 2022 Rank | Peak Hours Spent in Congestion per Auto Commuter |
|---|---|---|
| North Dakota | 1 | 4.23 |
| Maine | 2 | 6.65 |
| Iowa | 3 | 6.73 |
| Arkansas | 4 | 6.93 |
| Kansas | 5 | 7.1 |
| Mississippi | 6 | 7.3 |
| Idaho | 7 | 7.45 |
| Wyoming | 8 | 7.74 |
| Vermont | 9 | 9.15 |
| West Virginia | 10 | 9.2 |
| South Dakota | 11 | 9.62 |
| Oklahoma | 12 | 10.12 |
| Alaska | 13 | 10.16 |
| Ohio | 14 | 11.53 |
| Nebraska | 15 | 11.68 |
| Utah | 16 | 12.5 |
| Alabama | 17 | 13.48 |
| Montana | 18 | 13.65 |
| Hawaii | 19 | 14.86 |
| Missouri | 20 | 15.16 |
| North Carolina | 21 | 15.28 |
| Kentucky | 22 | 16.23 |
| South Carolina | 23 | 16.64 |
| Wisconsin | 24 | 16.72 |
| New Mexico | 25 | 16.8 |
| Michigan | 26 | 16.8 |
| Tennessee | 27 | 20.16 |
| Indiana | 28 | 22.38 |
| Minnesota | 29 | 22.48 |
| Arizona | 30 | 23.36 |
| Washington | 31 | 27.76 |
| Connecticut | 32 | 28.58 |
| New Hampshire | 33 | 32.91 |
| Louisiana | 34 | 34.27 |
| Nevada | 35 | 36.06 |
| Colorado | 36 | 36.21 |
| Virginia | 37 | 39.18 |
| Rhode Island | 38 | 41.51 |
| Florida | 39 | 44.95 |
| Texas | 40 | 45.91 |
| Oregon | 41 | 47.22 |
| Pennsylvania | 42 | 47.28 |
| Georgia | 43 | 53.83 |
| California | 44 | 60.27 |
| Maryland | 45 | 61.77 |
| Illinois | 46 | 64.6 |
| New York | 47 | 67.92 |
| Delaware | 48 | 82.79 |
| Massachusetts | 49 | 94.71 |
| New Jersey | 50 | 103.92 |
| Average | 41.33 |