


Rural Interstates are typically four- to six- lane highways connecting urban areas. One measurement of roadway condition is pavement condition. In most states, road pavement condition is measured using special machines that determine the roughness of road surfaces. A few states continue to use visual ratings, which are then converted to roughness. In 2022, about 2.03% of U.S. rural Interstates—594 miles out of 29,311—were reported to be in poor condition. (Table 11, Percent Rural Interstate Mileage in Poor Condition, 2022, Figure 6). This is similar to 2020, the last time this assessment was completed, when 609 miles out of 29,199 (2.09%) of rural Interstate pavement was rated poor.
Between 2020 and 2022, the percentage of poor rural Interstate mileage decreased in 23 states, increased in 20 states, and remained about the same in five states. The percentage of poor mileage changed by less than one percentage point in 44 of the states. West Virginia (1.55 points) and Maine (1.27 points) and Colorado (1.21 points) led the states in decreasing poor- condition mileage while Massachusetts, Louisiana, and Arizona led the states in increasing poor-condition mileage (by 2.59, 1.19, and 1.15 points, respectively).
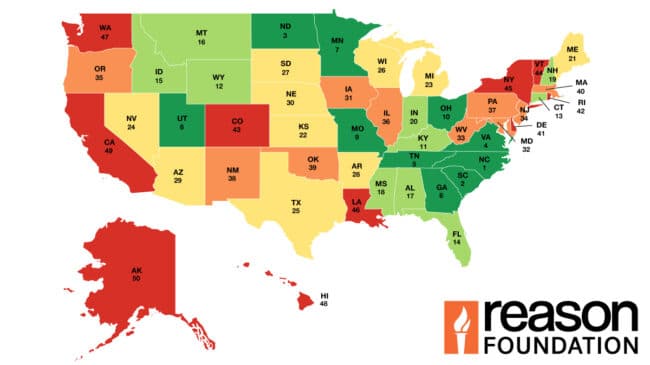
Rural Interstate mileage in poor condition varies widely by state. In 2022, one state—Rhode Island—reported zero poor mileage, as opposed to 2020 when all states reported at least some poor mileage. Twenty states reported less than 1% poor mileage. On the other hand, two states (Alaska and Colorado) continued to report more than 5% poor mileage. The two states together have about 5.6% of U.S. rural Interstate mileage (1,649 miles out of 29,310) but have 23.38% of the poor-condition mileage.
Delaware and Hawaii are the only states with no rural mileage in their Interstate systems.
28th Annual Highway Report: Percent Rural Interstate Mileage in Poor Condition, 2022
| State | 2022 Rank | Percent Rural Interstate Mileage in Poor Condition |
|---|---|---|
| Rhode Island | 1 | 0 |
| New Hampshire | 2 | 0.07 |
| Maine | 3 | 0.12 |
| Florida | 4 | 0.24 |
| Nevada | 5 | 0.27 |
| North Dakota | 6 | 0.32 |
| South Dakota | 7 | 0.35 |
| Minnesota | 8 | 0.37 |
| Connecticut | 9 | 0.38 |
| Utah | 10 | 0.41 |
| Virginia | 11 | 0.44 |
| New Jersey | 12 | 0.51 |
| Montana | 13 | 0.52 |
| Georgia | 14 | 0.59 |
| Kansas | 15 | 0.62 |
| Nebraska | 16 | 0.72 |
| Oregon | 17 | 0.79 |
| Missouri | 18 | 0.84 |
| Tennessee | 19 | 0.84 |
| North Carolina | 20 | 0.92 |
| Wyoming | 21 | 1.03 |
| Texas | 22 | 1.07 |
| Idaho | 23 | 1.09 |
| Kentucky | 24 | 1.19 |
| Maryland | 25 | 1.23 |
| Ohio | 26 | 1.26 |
| South Carolina | 27 | 1.49 |
| Iowa | 28 | 1.53 |
| Illinois | 29 | 1.53 |
| Wisconsin | 30 | 1.61 |
| Vermont | 31 | 1.73 |
| Mississippi | 32 | 1.73 |
| Alabama | 33 | 1.8 |
| Indiana | 34 | 1.86 |
| West Virginia | 35 | 1.89 |
| Oklahoma | 36 | 2.02 |
| Pennsylvania | 37 | 2.66 |
| Michigan | 38 | 2.88 |
| Arkansas | 39 | 2.97 |
| New Mexico | 40 | 3.31 |
| Arizona | 41 | 3.37 |
| New York | 42 | 3.41 |
| Massachusetts | 43 | 3.63 |
| Washington | 44 | 4.04 |
| Louisiana | 45 | 4.46 |
| California | 46 | 4.89 |
| Colorado | 47 | 7.11 |
| Alaska | 48 | 9.3 |
| Delaware | N/A | |
| Hawaii | N/A | |
| Average | 2.03 |