


Other disbursements include funds for law enforcement, safety, bonds, and interest payments. Since they include interest payments, they can vary widely from year to year. For 2022, other disbursements make up 24% of total funding. For 2022, other disbursements were 2% higher (26.2% of the total spending) than the last time this assessment was completed. In 2019, we measured other disbursements per lane- mile. For 2018, we measured other disbursements per centerline-mile, lane-mile, and vehicle-miles traveled (VMT) per lane-mile. This year, we measured other disbursements per lane- mile adjusted for urbanization, the same process that we used last year. For this process, we take the disbursement per lane-mile and divide it by the expected disbursement per lane-mile to calculate a ratio.
The average 2022 per lane-mile disbursement is $20,430. (Table 10, Other Disbursements, 2022, Figure 5). This equals a 6% decrease from $21,908 in 2020, the last time this assessment was completed. This change is in contrast with a sharply increasing spending trend over the last decade. Since 2007, total other disbursements have increased about 79%, a far higher amount than the Consumer Price Index (CPI), which has increased about 27.4%. This is likely the result of some states reclassifying certain types of disbursements. For example, administrative support for research projects, which was classified as an administrative disbursement, is now classified as an other disbursement.
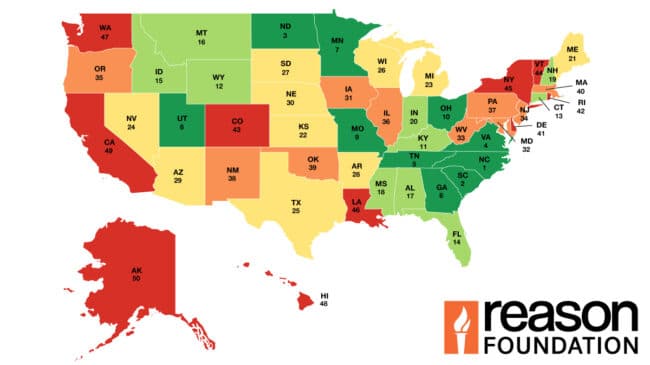
In 2022, South Carolina, Tennessee, North Carolina, West Virginia, and Virginia reported the lowest other expenditure disbursement ratios, after adjusting for urbanization. Washington, Kansas, Vermont, Maryland, and Alabama reported the highest expenditure ratios.
Compared to 2020, the states whose ratio worsened by the highest percent were Louisiana, Alabama, Georgia, Connecticut, and Illinois (244%, 188%, 111%, 75%, and 72% respectively). The states that improved the most were South Carolina (71%), New York (70%), Oregon (57%), North Carolina (53%), and North Dakota (52%). The disbursements per state-controlled lane-mile can vary widely from year to year reflecting funding actions and project schedules.
28th Annual Highway Report: Other Disbursements
| State | 2022 Rank | Disbursement Per Lane-Mile | Expected Disbursement per Lane-Mile | Adjusted Ratio |
|---|---|---|---|---|
| South Carolina | 1 | $386 | $24,670 | 0.02 |
| Tennessee | 2 | $1,106 | $29,828 | 0.04 |
| North Carolina | 3 | $3,377 | $22,952 | 0.15 |
| West Virginia | 4 | $2,257 | $7,498 | 0.3 |
| Virginia | 5 | $7,160 | $18,435 | 0.39 |
| Indiana | 6 | $10,125 | $21,468 | 0.47 |
| Rhode Island | 7 | $54,663 | $109,921 | 0.5 |
| Wyoming | 8 | $2,748 | $5,464 | 0.5 |
| Mississippi | 9 | $5,052 | $10,032 | 0.5 |
| Delaware | 10 | $20,990 | $40,994 | 0.51 |
| North Dakota | 11 | $1,807 | $3,285 | 0.55 |
| South Dakota | 12 | $2,001 | $3,450 | 0.58 |
| Colorado | 13 | $11,473 | $19,649 | 0.58 |
| Hawaii | 14 | $37,332 | $62,890 | 0.59 |
| Michigan | 15 | $22,115 | $34,592 | 0.64 |
| Nebraska | 16 | $3,158 | $4,932 | 0.64 |
| Iowa | 17 | $6,409 | $9,739 | 0.66 |
| Massachusetts | 18 | $163,596 | $242,064 | 0.68 |
| Texas | 19 | $14,352 | $21,067 | 0.68 |
| Connecticut | 20 | $94,223 | $134,307 | 0.7 |
| Arkansas | 21 | $7,943 | $10,792 | 0.74 |
| Georgia | 22 | $24,391 | $31,940 | 0.76 |
| Florida | 23 | $57,004 | $73,182 | 0.78 |
| Maine | 24 | $6,261 | $7,963 | 0.79 |
| Montana | 25 | $3,039 | $3,783 | 0.8 |
| Ohio | 26 | $26,132 | $32,338 | 0.81 |
| Missouri | 27 | $7,294 | $8,508 | 0.86 |
| Alaska | 28 | $7,797 | $8,903 | 0.88 |
| Illinois | 29 | $32,436 | $35,486 | 0.91 |
| Arizona | 30 | $22,829 | $23,662 | 0.96 |
| Kentucky | 31 | $8,559 | $8,707 | 0.98 |
| Utah | 32 | $26,483 | $24,787 | 1.07 |
| Pennsylvania | 33 | $29,681 | $26,364 | 1.13 |
| Nevada | 34 | $14,273 | $12,174 | 1.17 |
| New Mexico | 35 | $8,062 | $6,700 | 1.2 |
| Minnesota | 36 | $14,268 | $11,817 | 1.21 |
| Oregon | 37 | $16,400 | $13,355 | 1.23 |
| New Jersey | 38 | $377,917 | $275,160 | 1.37 |
| Wisconsin | 39 | $27,673 | $19,834 | 1.4 |
| Idaho | 40 | $9,865 | $6,723 | 1.47 |
| New York | 41 | $53,694 | $35,908 | 1.5 |
| Oklahoma | 42 | $15,519 | $10,361 | 1.5 |
| California | 43 | $61,783 | $36,942 | 1.67 |
| New Hampshire | 44 | $22,084 | $12,701 | 1.74 |
| Louisiana | 45 | $39,344 | $21,960 | 1.79 |
| Alabama | 46 | $47,857 | $25,526 | 1.87 |
| Maryland | 47 | $100,531 | $52,123 | 1.93 |
| Vermont | 48 | $16,837 | $6,860 | 2.45 |
| Kansas | 49 | $18,529 | $7,347 | 2.52 |
| Washington | 50 | $81,028 | $26,123 | 3.1 |