


Iowa's Rankings in the
28th Annual Highway Report
Iowa’s highway system ranks 31st in the nation in overall cost-effectiveness and condition.
According to the Annual Highway Report by Reason Foundation, this is consistent with Iowa’s ranking of 31st overall in the last evaluation of the condition, safety, and costs of roads and bridges in all 50 states.
In safety and condition categories, Iowa’s highways rank 24th in urban Interstate pavement condition, 28th in rural Interstate pavement condition, 26th in urban arterial pavement condition, 40th in rural arterial pavement condition, 49th in structurally deficient bridges, 11th in urban fatality rate, and 6th in rural fatality rate.
Iowa ranks 3rd out of the 50 states in traffic congestion, and its drivers spend seven hours a year stuck in traffic congestion.
In spending and cost-effectiveness, Iowa ranks 44th in capital and bridge disbursements, which are the costs of building new roads and bridges and widening existing ones. Iowa ranks 21st in maintenance spending, such as the costs of repaving roads and filling in potholes. Iowa’s administrative disbursements, including office spending that doesn’t make its way to roads, ranks 33rd nationwide.
The categories in which the state improved the most from the previous report were urban fatality rate (22nd to 11th) and urban Interstate pavement condition (33rd to 24th).
Iowa worsened the most in the administrative disbursements (from 17th to 33rd).
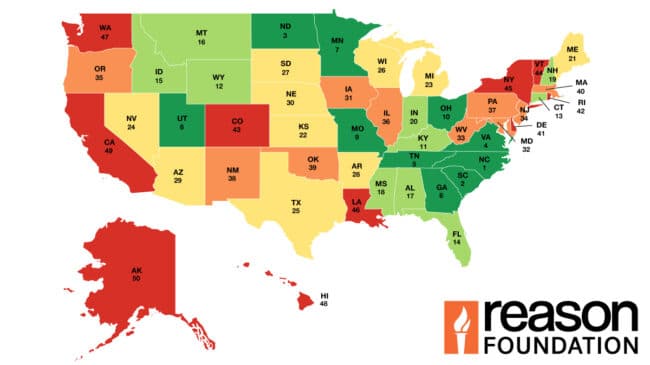
Compared to neighboring and nearby states, Iowa’s overall highway performance is better than Illinois’ (36th) but worse than Minnesota’s (7th), Missouri’s (9th), Wisconsin’s (26th), South Dakota’s (27th), and Nebraska’s (30th).
Comparing its overall performance to similarly populated states, Iowa ranks behind Utah (8th) and Connecticut (13th).
Iowa’s highway system ranks 31st out of 50 states overall this year, ranked 31st in last year’s report, and was 31st in the nation five years ago, in 2019.
“In terms of improving in the road condition and performance categories, Iowa should look to lower capital-bridge disbursements, as that is the only performance-based category in which the state ranks in the bottom 10,” said Baruch Feigenbaum, lead author of the 28th Annual Highway Report and senior managing director of transportation policy at Reason Foundation. “Additionally, when looking at safety-focused categories, the state should prioritize lowering the percentage of structurally deficient bridges in the state. It’s ranking of 49th in bridges is its worse by far of all categories examined in this report.”
Reason Foundation’s 28th Annual Highway Report measures the condition and cost-effectiveness of state-controlled highways in 13 categories, including pavement and bridge conditions, traffic fatalities, and spending. In the performance categories, ranking first implies the state has the best or lowest fatality rate and its road pavement is in the best condition. A ranking of 50th in performance categories means the state has the worst fatality rates or pavement conditions. In simplified terms, in the cost-effectiveness categories, a rank of 50 means the state spends more money, and a first-place ranking means the state spends less money than other states in that category.
The report’s data are primarily information each state directly reported to the Federal Highway Administration for 2022. Better Roads and Bridges provides the deficient bridge data, and the Texas A&M Transportation Institute provides the traffic congestion data.
Please see the complete 28th Annual Highway Report for detailed methodology and a comprehensive list of data sources.