


Administrative disbursements typically include general and main- office expenditures in support of state-administered highways. They do not include project-related costs but occasionally include “parked” funds, which are funds from bond sales or asset sales awaiting later expenditure. Therefore, they can vary widely from year to year.
Administrative disbursements comprise about 7.4% of total disbursements, totaling $11.94 billion in 2022, an 18.4% increase from 2020, the last time this assessment was completed.
In 2019, we measured administrative disbursements per lane-mile. For 2018, we measured administrative disbursements per centerline-mile, lane-mile, and vehicle-miles traveled (VMT) per
lane-mile. This year, we measured administrative disbursements per lane-mile adjusted for urbanization, the same process that we used last year. For this process, we take the administrative disbursement per lane-mile and divide it by the expected administrative disbursement per lane-mile to get a ratio.
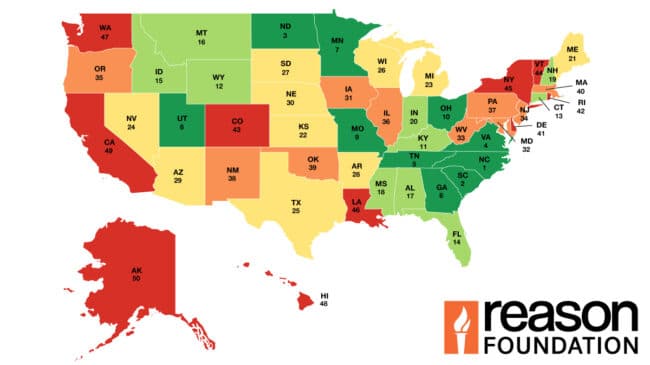
The average 2022 per lane-mile disbursement is $6,308 (Table 9, Administrative Disbursements, 2022, Figure 4). The average disbursement per lane-mile increased 16.4% from 2020 ($5,432 disbursement per lane-mile), the last time this assessment was completed. This change is in line with an increasing spending trend over the last decade. Since 2007, total administrative disbursements have increased about 27.4%, the same amount as the Consumer Price Index (CPI), which has also increased about 27.4%.
In 2022, North Carolina, Kentucky, Arkansas, Louisiana, and Missouri reported the lowest administrative expenditure ratios, after adjusting for urbanization. Vermont, Nevada, Delaware, Washington, New Hampshire, and South Dakota reported the highest expenditure ratios. Compared to 2020, the states whose ratio worsened by the largest percentages were Texas, Nebraska, Illinois, Massachusetts, and Maine (345%, 241%, 100%, 87%, and 74% respectively). The states that improved the most were North Carolina (70%), Missouri (62%), New Jersey (58%), Ohio (56%), and Wyoming (51%). The disbursements per state-controlled lane-mile can vary widely from year to year reflecting funding actions and project schedules.
28th Annual Highway Report: Administrative Disbursements, 2022
| State | 2022 Rank | Disbursement Per Lane-Mile | Expected Disbursement per Lane-Mile | Adjusted Ratio |
|---|---|---|---|---|
| North Carolina | 1 | $712 | $7,758 | 0.09 |
| Kentucky | 2 | $637 | $5,712 | 0.11 |
| Arkansas | 3 | $1,083 | $6,444 | 0.17 |
| Louisiana | 4 | $1,360 | $7,830 | 0.17 |
| Missouri | 5 | $1,040 | $5,648 | 0.18 |
| South Carolina | 6 | $1,557 | $7,710 | 0.2 |
| West Virginia | 7 | $1,893 | $5,269 | 0.36 |
| Mississippi | 8 | $2,235 | $6,192 | 0.36 |
| Wyoming | 9 | $1,645 | $4,414 | 0.37 |
| New Jersey | 10 | $9,515 | $19,595 | 0.49 |
| Maine | 11 | $2,652 | $5,453 | 0.49 |
| Virginia | 12 | $3,787 | $7,671 | 0.49 |
| Michigan | 13 | $5,279 | $9,967 | 0.53 |
| Connecticut | 14 | $8,281 | $15,561 | 0.53 |
| North Dakota | 15 | $1,825 | $3,328 | 0.55 |
| Indiana | 16 | $4,671 | $7,857 | 0.59 |
| Idaho | 17 | $3,031 | $4,948 | 0.61 |
| Ohio | 18 | $5,618 | $9,072 | 0.62 |
| Montana | 19 | $2,239 | $3,603 | 0.62 |
| Rhode Island | 20 | $9,368 | $14,789 | 0.63 |
| Alaska | 21 | $3,683 | $5,775 | 0.64 |
| Maryland | 22 | $9,100 | $12,612 | 0.72 |
| Florida | 23 | $9,990 | $13,505 | 0.74 |
| Wisconsin | 24 | $5,956 | $7,827 | 0.76 |
| Hawaii | 25 | $10,054 | $13,094 | 0.77 |
| Colorado | 26 | $6,368 | $7,809 | 0.82 |
| Utah | 27 | $6,435 | $7,718 | 0.83 |
| Tennessee | 28 | $7,021 | $8,371 | 0.84 |
| Nebraska | 29 | $3,555 | $4,172 | 0.85 |
| Illinois | 30 | $8,965 | $10,441 | 0.86 |
| Pennsylvania | 31 | $6,784 | $7,850 | 0.86 |
| Georgia | 32 | $7,744 | $8,940 | 0.87 |
| Iowa | 33 | $5,640 | $6,079 | 0.93 |
| Kansas | 34 | $5,457 | $5,207 | 1.05 |
| California | 35 | $13,031 | $11,280 | 1.16 |
| Minnesota | 36 | $7,733 | $6,680 | 1.16 |
| Oklahoma | 37 | $7,470 | $6,310 | 1.18 |
| Texas | 38 | $11,195 | $7,870 | 1.42 |
| Oregon | 39 | $10,056 | $6,945 | 1.45 |
| New York | 40 | $15,902 | $10,702 | 1.49 |
| Arizona | 41 | $13,442 | $7,713 | 1.74 |
| Alabama | 42 | $14,078 | $7,776 | 1.81 |
| Massachusetts | 43 | $36,698 | $18,682 | 1.96 |
| New Mexico | 44 | $9,768 | $4,939 | 1.98 |
| South Dakota | 45 | $6,988 | $3,421 | 2.04 |
| New Hampshire | 46 | $15,603 | $6,837 | 2.28 |
| Washington | 47 | $18,771 | $7,827 | 2.4 |
| Delaware | 48 | $28,951 | $11,959 | 2.42 |
| Nevada | 49 | $16,942 | $6,745 | 2.51 |
| Vermont | 50 | $16,404 | $5,005 | 3.28 |
The Difference Between Maintenance and Administrative Disbursements
Some disbursement data can be counted in one of several categories. One example is benefits (vacation, health care, etc.) of state department of transportation maintenance workers. Certain states such as Vermont count the benefits as a maintenance disbursement since the employees are conducting routine highway maintenance. Other states, such as Delaware, count the benefits as an administrative disbursement since benefits are an administrative expense. Not surprisingly, Vermont ranks in the bottom 10 in Maintenance Disbursements, and Delaware has a bottom 10 ranking in Administrative Disbursements. As a result, it is important to look at both the individual disbursement categories and disbursements as a whole, as states have some leeway in their classification of certain expenditures.