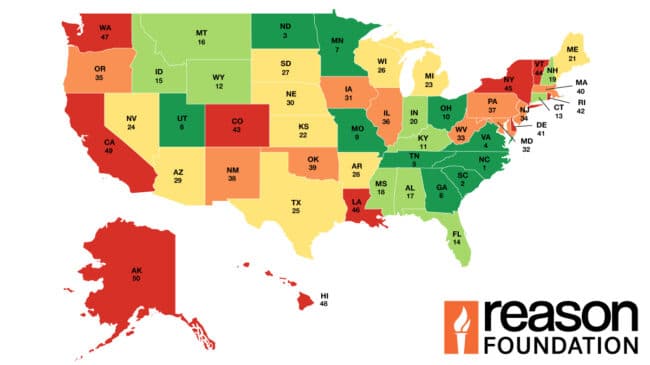


Urban other principal arterials (UOPA) are four- to eight-lane highways connecting different parts of an urban region. Overall, about 12.95% of the UOPA system—8,091 miles out of 62,483—was reported to be in poor condition (Table 13, Percent Urban Other Principal Arterial Mileage in Poor Condition, 2022, Figure 9). This is a 1.24-point decrease from 2019 when 14.19% or 9,105 miles out of 64,183 miles were in poor condition. Overall urban arterials are in much worse condition than rural arterials, rural Interstates, or urban Interstates with the percentage in poor condition at 1.00%, 2.03%, and 4.55% respectively.
The percentage of UOPA mileage in poor condition varies drastically by state, ranging from Alabama with 1.04% to California with 31.17%. Thirteen states reported less than 5% of UOPA miles in poor condition. On the other hand, five states (Massachusetts, New York, Rhode Island, Nebraska, and California) reported more than 20% of their UOPA mileage was in poor condition. These five states have 18.82% of the U.S. ROPA mileage, but 40.31% of the mileage that is in poor condition.
Between 2020 and 2022, 27 states saw minor changes (<1%) in UOPA pavement condition. Thirteen states had more than a 1% decrease of poor mileage, and 10 states saw an increase of poor mileage. The percentage of the UOPA system in poor condition in California (8.63), Idaho (8.34), and Michigan (6.05) decreased, while the poor mileage in Kentucky, Maryland, and Alaska increased (by 2.36, 2.31, and 2.22 points, respectively).
28th Annual Highway Report: Percent Urban Other Principal Arterial Mileage in Poor Condition, 2022
| State | 2022 Rank | Percent Urban Other Principal Arterial Mileage in Poor Condition |
|---|---|---|
| Alabama | 1 | 1.04 |
| Minnesota | 2 | 1.37 |
| Georgia | 3 | 2 |
| Indiana | 4 | 2.03 |
| Florida | 5 | 2.64 |
| Utah | 6 | 2.77 |
| South Carolina | 7 | 3.03 |
| New Hampshire | 8 | 4.39 |
| Tennessee | 9 | 4.67 |
| North Carolina | 10 | 4.81 |
| Nevada | 11 | 4.82 |
| Idaho | 12 | 4.89 |
| West Virginia | 13 | 4.91 |
| Kentucky | 14 | 5.92 |
| South Dakota | 15 | 5.96 |
| Delaware | 16 | 6.3 |
| Virginia | 17 | 6.36 |
| Wyoming | 18 | 6.53 |
| Alaska | 19 | 6.7 |
| Arizona | 20 | 7.05 |
| Kansas | 21 | 7.64 |
| Missouri | 22 | 8.16 |
| Oregon | 23 | 8.27 |
| Vermont | 24 | 8.65 |
| North Dakota | 25 | 8.8 |
| Iowa | 26 | 9.04 |
| Montana | 27 | 9.32 |
| Connecticut | 28 | 9.46 |
| Maine | 29 | 9.47 |
| Arkansas | 30 | 10.38 |
| Oklahoma | 31 | 10.45 |
| Mississippi | 32 | 10.74 |
| Michigan | 33 | 10.9 |
| Illinois | 34 | 11.55 |
| Colorado | 35 | 12.08 |
| Ohio | 36 | 12.88 |
| Pennsylvania | 37 | 13.43 |
| Texas | 38 | 13.46 |
| New Mexico | 39 | 14.01 |
| Hawaii | 40 | 14.22 |
| New Jersey | 41 | 15.36 |
| Louisiana | 42 | 17.5 |
| Washington | 43 | 18.21 |
| Wisconsin | 44 | 18.46 |
| Maryland | 45 | 19.12 |
| Massachusetts | 46 | 23.01 |
| New York | 47 | 23.8 |
| Rhode Island | 48 | 25.28 |
| Nebraska | 49 | 30.15 |
| California | 50 | 31.17 |
| Average | 12.95 |