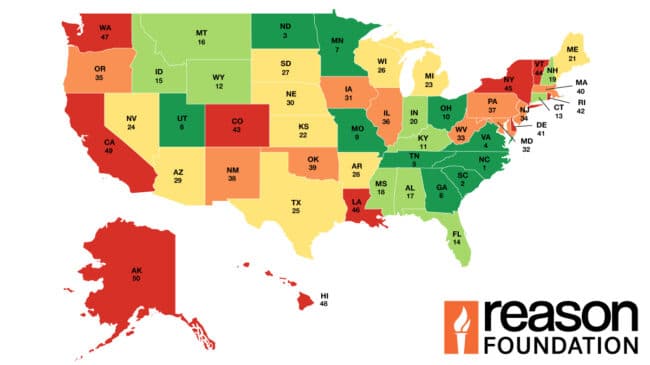


Urban Interstates are major multi-lane highways in urbanized areas. The pavement condition of the urban Interstate system improved from 2020 to 2022, decreasing from 4.77% in poor condition to 4.55% (Table 12, Percent Urban Interstate Mileage in Poor Condition, 2022, Figure 7). In 2022, 869 of 19,089 miles of urban Interstate highways were rated as poor, the exact same numbers as in 2020, the last time this assessment was completed. (The percentage poor Interstate mileage decreased even as the number of poor Interstate miles stayed the same because the overall urban Interstate mileage increased.)
Between 2020 and 2022, the percentage of poor urban Interstate mileage increased in 19 states and decreased in 31 states. The percentage of poor mileage changed by less than one percentage point in 34 of the states. Despite Hawaii and New Jersey ranking in the bottom 10 of the list, they, alongside West Virginia, led the states in reducing poor-condition mileage (6.33 points for Hawaii, 4.94 points for West Virginia, and 2.76 points for New Jersey), while Louisiana and Kentucky led the states in increasing poor-condition mileage (by 1.82 and 1.65 points, respectively).
The condition of urban Interstate highways also varies widely by state. In 2022, New Hampshire was the only state to report no mileage in poor condition. The bottom two states (Hawaii and Louisiana) continued to report more than 10% of their mileage to be in poor condition. These two states, collectively, only have 2.45% of the urban Interstate mileage in the U.S. (468 of 19,089 miles) but have over 7.8% of the mileage in poor condition (68 of 869 miles).
28th Annual Highway Report: Percent Urban Interstate Mileage in Poor Condition, 2022
| State | 2022 Rank | Percent Urban Interstate Mileage in Poor Condition |
|---|---|---|
| New Hampshire | 1 | 0 |
| Montana | 2 | 0.31 |
| North Dakota | 3 | 0.49 |
| Rhode Island | 4 | 0.58 |
| Vermont | 5 | 0.59 |
| Maine | 6 | 0.76 |
| Idaho | 7 | 0.86 |
| Alaska | 8 | 0.95 |
| Florida | 9 | 1.02 |
| South Carolina | 10 | 1.11 |
| South Dakota | 11 | 1.15 |
| Arizona | 12 | 1.47 |
| Georgia | 13 | 1.53 |
| Minnesota | 14 | 1.66 |
| Connecticut | 15 | 1.83 |
| Tennessee | 16 | 1.97 |
| North Carolina | 17 | 2.2 |
| Utah | 18 | 2.26 |
| Oregon | 19 | 2.74 |
| Nevada | 20 | 2.75 |
| Kansas | 21 | 2.79 |
| Indiana | 22 | 2.92 |
| Missouri | 23 | 3.17 |
| Iowa | 24 | 3.22 |
| Nebraska | 25 | 3.31 |
| Virginia | 26 | 3.52 |
| Washington | 27 | 3.59 |
| Massachusetts | 28 | 3.62 |
| Alabama | 29 | 3.87 |
| Kentucky | 30 | 3.97 |
| West Virginia | 31 | 4.05 |
| Ohio | 32 | 4.15 |
| Wisconsin | 33 | 4.19 |
| Texas | 34 | 4.2 |
| Mississippi | 35 | 4.49 |
| New Mexico | 36 | 4.68 |
| Illinois | 37 | 4.76 |
| Oklahoma | 38 | 5.18 |
| Pennsylvania | 39 | 5.36 |
| Arkansas | 40 | 6.04 |
| Michigan | 41 | 6.17 |
| Wyoming | 42 | 6.37 |
| New Jersey | 43 | 6.56 |
| Maryland | 44 | 6.92 |
| Colorado | 45 | 7.98 |
| Delaware | 46 | 9.35 |
| California | 47 | 9.39 |
| New York | 48 | 9.65 |
| Louisiana | 49 | 13.81 |
| Hawaii | 50 | 19.55 |
| Average | 4.55 |