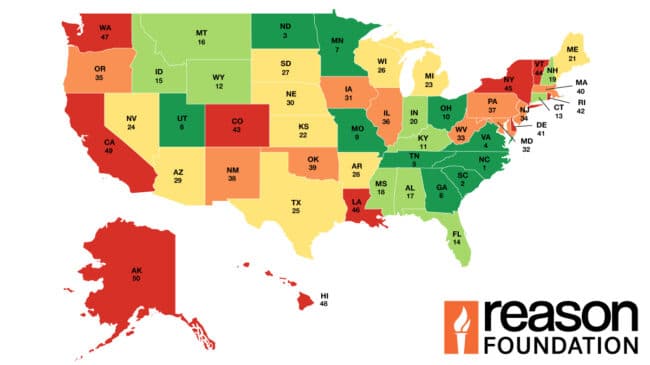


The urban fatality rate measures fatalities on all urban arterials in the state. The nation’s urban highway fatality rate worsened slightly from 1.04 in 2020 to 1.07 in 2022 (Table 19, Urban Fatality Rate per 100 Million Vehicle-Miles, 2022, Figure 13). The urban fatality rate has increased over the last several years after a decades-long downward trend. While there is no one cause, distracted driving may be a significant contributor. In 2022, 13,545 urban fatalities were reported, more than the 11,889 urban fatalities reported in 2020, as urban VMT (vehicle-miles of travel) increased to 1.26 trillion from 1.14 trillion in 2020, partly as a result of the return to in-person work post- COVID-19.
For 2022, Minnesota reported the lowest urban fatality rate, 0.49, while New Mexico reported the highest, 1.88. Ten states saw their fatality rate decrease compared with 2020, led by Wyoming (0.56 points) and Kentucky (0.30 points). Fifteen states saw their urban fatality rate increase led by Arkansas and Montana (at 0.96 and 0.65 points, respectively).
28th Annual Highway Report: Fatality Rate Per 100 Million Urban Vehicle-Miles
| State | 2022 Rank | Fatality Rate Per 100 Million Urban Vehicle-Miles |
|---|---|---|
| Minnesota | 1 | 0.49 |
| Rhode Island | 2 | 0.59 |
| New Hampshire | 3 | 0.63 |
| Maine | 4 | 0.64 |
| Idaho | 5 | 0.65 |
| North Dakota | 6 | 0.65 |
| Vermont | 7 | 0.68 |
| Massachusetts | 8 | 0.70 |
| North Carolina | 9 | 0.72 |
| Wisconsin | 10 | 0.74 |
| Iowa | 11 | 0.75 |
| Ohio | 12 | 0.76 |
| West Virginia | 13 | 0.77 |
| Wyoming | 14 | 0.81 |
| South Dakota | 15 | 0.82 |
| New Jersey | 16 | 0.83 |
| Utah | 17 | 0.83 |
| New York | 18 | 0.86 |
| Kansas | 19 | 0.90 |
| Pennsylvania | 20 | 0.94 |
| Illinois | 21 | 0.95 |
| Kentucky | 22 | 0.96 |
| Virginia | 23 | 0.97 |
| Michigan | 24 | 1.00 |
| Nevada | 25 | 1.01 |
| Connecticut | 26 | 1.01 |
| Washington | 27 | 1.02 |
| Maryland | 28 | 1.03 |
| Alabama | 29 | 1.04 |
| Oklahoma | 30 | 1.04 |
| Nebraska | 31 | 1.05 |
| Missouri | 32 | 1.08 |
| California | 33 | 1.09 |
| Texas | 34 | 1.15 |
| Oregon | 35 | 1.17 |
| Delaware | 36 | 1.20 |
| Louisiana | 37 | 1.21 |
| Arizona | 38 | 1.24 |
| Georgia | 39 | 1.24 |
| Colorado | 40 | 1.27 |
| South Carolina | 41 | 1.33 |
| Mississippi | 42 | 1.35 |
| Tennessee | 43 | 1.39 |
| Montana | 44 | 1.44 |
| Indiana | 45 | 1.48 |
| Arkansas | 46 | 1.52 |
| Hawaii | 47 | 1.55 |
| Florida | 48 | 1.56 |
| Alaska | 49 | 1.87 |
| New Mexico | 50 | 1.88 |
| Average | 1.07 |