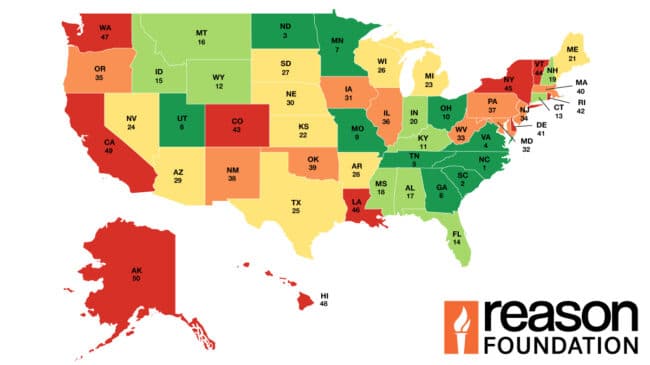


Rural other principal arterials (ROPA) are two- to four-lane highways connecting different cities or regions. The condition of major rural arterials improved slightly from 2020 to 2022, by about 0.13 percentage points. Overall, about 1% of the ROPA system—906 miles out of 90,315—was reported to be in poor condition (Table 13, Percent Rural Other Principal Arterial Mileage in Poor Condition, 2022, Figure 8). This compares with about 1.13% (1,016 of 89,778 miles) in 2020, the last time this assessment was completed. (It should be noted that as cities grow, the urbanized area around them grows as well. As this occurs, highways near cities are often reclassified from rural to urban. If these highways were in good condition already, their reclassification has the effect of increasing the percentage of rural roads in poor condition.)
Between 2020 and 2022, the percentage of ROPA increased in 22 states and decreased in 28 states. The percent of poor mileage changed less than one percentage point in 44 of the states. Idaho (2.75 points) and Alaska (1.79 points) led the states in decreasing poor condition mileage while Vermont and Rhode Island (by 2.78 points and 2.28 points respectively) led the states in increasing poor condition mileage.
The condition of ROPA miles varies widely by state. In 2022, all states reported at least some poor ROPA mileage. Twenty-six states reported 1% or less of their ROPA mileage was in poor condition. On the other hand, Alaska reported 12% of its ROPA mileage was in poor condition. Alaska has only 0.58% of the U.S. ROPA mileage, but 6.9% of the mileage that is in poor condition.
28th Annual Highway Report: Percent Rural Other Principal Arterial Mileage in Poor Condition, 2022
| State | 2022 Rank | Percent Rural Other Principal Arterial Mileage in Poor Condition |
|---|---|---|
| Nevada | 1 | 0.09 |
| Georgia | 2 | 0.21 |
| Indiana | 3 | 0.22 |
| Alabama | 4 | 0.25 |
| Florida | 5 | 0.26 |
| Wyoming | 6 | 0.26 |
| Kentucky | 7 | 0.28 |
| Virginia | 8 | 0.32 |
| Ohio | 9 | 0.36 |
| Utah | 10 | 0.36 |
| Texas | 11 | 0.41 |
| Idaho | 12 | 0.46 |
| Kansas | 13 | 0.48 |
| Missouri | 14 | 0.49 |
| North Carolina | 15 | 0.5 |
| Michigan | 16 | 0.51 |
| Minnesota | 17 | 0.52 |
| Tennessee | 18 | 0.58 |
| New Hampshire | 19 | 0.64 |
| North Dakota | 20 | 0.66 |
| Delaware | 21 | 0.67 |
| South Carolina | 22 | 0.68 |
| South Dakota | 23 | 0.74 |
| Montana | 24 | 0.76 |
| Washington | 25 | 0.82 |
| Oregon | 26 | 0.88 |
| Maryland | 27 | 1.02 |
| New York | 28 | 1.05 |
| New Jersey | 29 | 1.06 |
| Arizona | 30 | 1.08 |
| Pennsylvania | 31 | 1.29 |
| Connecticut | 32 | 1.37 |
| Massachusetts | 33 | 1.43 |
| New Mexico | 34 | 1.46 |
| Nebraska | 35 | 1.47 |
| Arkansas | 36 | 1.51 |
| Colorado | 37 | 1.52 |
| Mississippi | 38 | 1.53 |
| Wisconsin | 39 | 1.56 |
| Iowa | 40 | 1.69 |
| California | 41 | 1.92 |
| Illinois | 42 | 2.09 |
| Oklahoma | 43 | 2.15 |
| Maine | 44 | 2.2 |
| West Virginia | 45 | 2.56 |
| Louisiana | 46 | 2.86 |
| Hawaii | 47 | 4.02 |
| Vermont | 48 | 4.08 |
| Rhode Island | 49 | 6.04 |
| Alaska | 50 | 11.99 |
| Average | 1 |