


The rural fatality rate measures fatalities on all rural arterials in the state. The nation’s rural highway fatality rate improved from 1.30 in 2020 to 1.25 in 2022 (Table 18, Rural Fatality Rate per 100 Million Vehicle- Miles, 2022, Figure 12). In 2022, 6,466 rural fatalities were reported, more than the 5,822 rural fatalities reported in 2020, as rural VMT (vehicle-miles of travel) increased from 0.45 trillion miles in 2020 to 0.51 trillion miles in 2022, partly due to the economic recovery from COVID-19. (The increase in fatalities is a consequence of the significant increase in vehicle-miles driven, even as the overall rate decreased.)
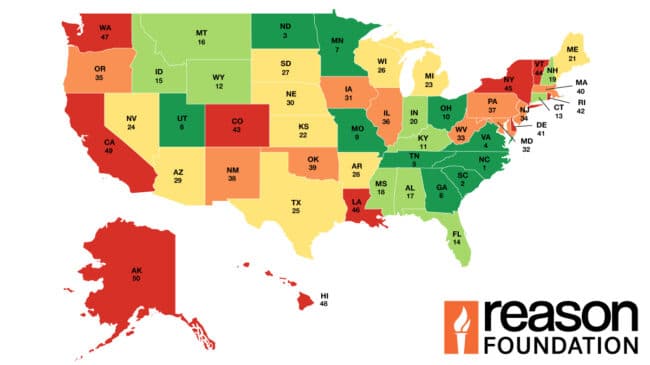
For 2022, Maryland reported the lowest rural fatality rate, 0.13, while Hawaii reported the highest, 4.04.
Forty-four states reported an increase in their rural fatality rate compared to 2020, led by Delaware (1.81 points), Hawaii (1.81 points), and Alaska (1.36 points). No states had rates that remained the same. Six states saw their fatality rate decrease, led by South Carolina, Maryland, and Indiana (at 0.46, 0.31, and 0.17 points, respectively.)
28th Annual Highway Report: Fatality Rate per 100 Million Rural Vehicle-Miles, 2022
| State | 2022 Rank | Fatality Rate Per 100 Million Rural Vehicle-Miles |
|---|---|---|
| Maryland | 1 | 0.13 |
| Minnesota | 2 | 0.6 |
| Michigan | 3 | 0.61 |
| New York | 4 | 0.67 |
| New Jersey | 5 | 0.73 |
| Iowa | 6 | 0.74 |
| Wisconsin | 7 | 0.74 |
| Vermont | 8 | 0.79 |
| Ohio | 9 | 0.86 |
| Utah | 10 | 0.89 |
| Kansas | 11 | 0.91 |
| Pennsylvania | 12 | 0.92 |
| Louisiana | 13 | 0.95 |
| Indiana | 14 | 0.95 |
| Maine | 15 | 1.01 |
| Illinois | 16 | 1.04 |
| Kentucky | 17 | 1.04 |
| Washington | 18 | 1.05 |
| New Hampshire | 19 | 1.07 |
| Nebraska | 20 | 1.12 |
| South Dakota | 21 | 1.13 |
| Oklahoma | 22 | 1.16 |
| Idaho | 23 | 1.17 |
| Massachusetts | 24 | 1.19 |
| Georgia | 25 | 1.21 |
| Missouri | 26 | 1.21 |
| Tennessee | 27 | 1.23 |
| California | 28 | 1.27 |
| North Dakota | 29 | 1.31 |
| Connecticut | 30 | 1.37 |
| Rhode Island | 31 | 1.38 |
| Colorado | 32 | 1.45 |
| Alabama | 33 | 1.47 |
| West Virginia | 34 | 1.5 |
| Virginia | 35 | 1.52 |
| Wyoming | 36 | 1.54 |
| Texas | 37 | 1.56 |
| Florida | 38 | 1.59 |
| North Carolina | 39 | 1.64 |
| Mississippi | 40 | 1.66 |
| Montana | 41 | 1.69 |
| New Mexico | 42 | 1.73 |
| Arkansas | 43 | 1.75 |
| South Carolina | 44 | 1.78 |
| Arizona | 45 | 1.8 |
| Oregon | 46 | 1.84 |
| Nevada | 47 | 1.96 |
| Alaska | 48 | 2.68 |
| Delaware | 49 | 2.99 |
| Hawaii | 50 | 4.04 |
| Average | 1.25 |