


Capital and bridge disbursements are the costs to build new, and widen existing, highways and bridges.
Capital and bridge disbursements for state-owned roads equal 51.2% of total disbursements, totaling $78.68 billion in 2022, 0.2% less than what was spent in 2020.
In 2019, we measured capital and bridge disbursements per lane-mile. For 2018, we measured capital and bridge disbursements per centerline-mile, lane-mile, and vehicle-miles traveled (VMT) per lane-mile. This year we measured disbursements per lane-mile adjusted for urbanization, the same process that we used last year. For this year’s calculations, we take the disbursement per lane-mile and divide it by the expected disbursement per lane-mile to get a ratio. The average 2022 lane-mile disbursement is $43,674, a 4.5% increase from 2020’s $41,783 (Table 7, Capital and Bridge Disbursements, 2022, Figure 2). This increase continues a decade-long trend of steady increases in spending. Since 2012, total capital and bridge disbursements have increased about 26.1%, similar to the Consumer Price Index (CPI), which has increased about 27.4%.
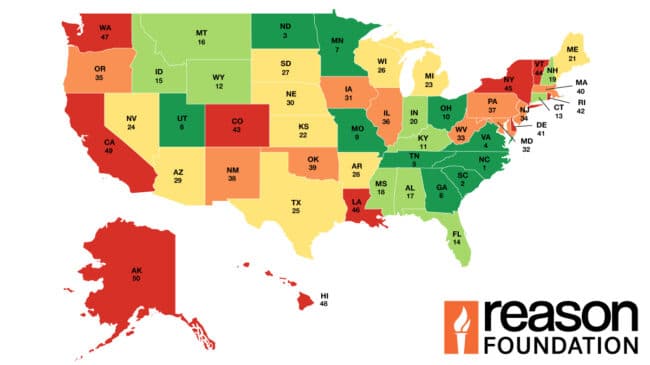
In 2022, Virginia, South Carolina, Missouri, West Virginia, and Delaware reported the lowest capital and bridge expenditure ratios, after adjusting for urbanization. Washington, Idaho, Alaska, Utah, and Indiana reported the highest expenditure ratios. Compared to 2020, the states whose ratio increased by the highest percentage were Kansas, South Dakota, Arkansas, Louisiana, and Colorado (97%, 44%, 39%, 34%, and 30% respectively). The states that improved the most were Montana (37%), Arizona (34%), New Hampshire (29%), Ohio (21%), and Alaska (20%). The disbursements per state-controlled lane-mile can vary widely from year to year reflecting funding actions and project schedules.
28th Annual Highway Report: Capital & Bridge Disbursements, 2022
| State | 2022 Rank | Disbursement Per Lane-Mile | Expected Disbursement per Lane-Mile | Adjusted Ratio |
|---|---|---|---|---|
| Virginia | 1 | $15,981 | $43,388 | 0.37 |
| South Carolina | 2 | $17,706 | $44,976 | 0.39 |
| Missouri | 3 | $14,177 | $35,048 | 0.4 |
| West Virginia | 4 | $12,820 | $28,193 | 0.45 |
| Delaware | 5 | $41,505 | $85,806 | 0.48 |
| Ohio | 6 | $33,467 | $60,795 | 0.55 |
| North Carolina | 7 | $25,292 | $44,168 | 0.57 |
| Georgia | 8 | $36,376 | $60,186 | 0.6 |
| New Hampshire | 9 | $24,247 | $39,829 | 0.61 |
| New Mexico | 10 | $20,630 | $32,109 | 0.64 |
| Tennessee | 11 | $36,203 | $56,072 | 0.65 |
| Massachusetts | 12 | $105,038 | $161,416 | 0.65 |
| Mississippi | 13 | $24,601 | $37,224 | 0.66 |
| Louisiana | 14 | $29,723 | $44,275 | 0.67 |
| Kentucky | 15 | $24,297 | $35,328 | 0.69 |
| Montana | 16 | $18,046 | $25,861 | 0.7 |
| Pennsylvania | 17 | $35,221 | $47,980 | 0.73 |
| Connecticut | 18 | $104,189 | $129,548 | 0.8 |
| Maryland | 19 | $82,833 | $95,568 | 0.87 |
| Hawaii | 20 | $89,740 | $101,487 | 0.88 |
| Maine | 21 | $30,576 | $34,241 | 0.89 |
| Alabama | 22 | $42,424 | $46,315 | 0.92 |
| Wyoming | 23 | $28,080 | $29,735 | 0.94 |
| Wisconsin | 24 | $42,314 | $44,115 | 0.96 |
| Arkansas | 25 | $36,710 | $38,170 | 0.96 |
| North Dakota | 26 | $24,849 | $24,515 | 1.01 |
| Arizona | 27 | $45,242 | $44,257 | 1.02 |
| Nebraska | 28 | $29,593 | $28,602 | 1.03 |
| Minnesota | 29 | $41,462 | $39,143 | 1.06 |
| Rhode Island | 30 | $131,248 | $121,112 | 1.08 |
| South Dakota | 31 | $27,338 | $24,973 | 1.09 |
| Texas | 32 | $49,221 | $44,365 | 1.11 |
| Michigan | 33 | $72,443 | $65,194 | 1.11 |
| Oregon | 34 | $46,644 | $40,291 | 1.16 |
| Vermont | 35 | $38,140 | $32,293 | 1.18 |
| Nevada | 36 | $47,977 | $39,432 | 1.22 |
| Oklahoma | 37 | $48,326 | $37,662 | 1.28 |
| Kansas | 38 | $43,114 | $33,239 | 1.3 |
| New Jersey | 39 | $223,423 | $170,211 | 1.31 |
| Florida | 40 | $143,152 | $106,406 | 1.35 |
| New York | 41 | $94,539 | $70,194 | 1.35 |
| Colorado | 42 | $60,442 | $44,024 | 1.37 |
| California | 43 | $105,493 | $75,858 | 1.39 |
| Iowa | 44 | $52,199 | $36,803 | 1.42 |
| Illinois | 45 | $98,386 | $68,213 | 1.44 |
| Indiana | 46 | $69,843 | $44,339 | 1.58 |
| Utah | 47 | $73,090 | $45,128 | 1.62 |
| Alaska | 48 | $59,277 | $35,592 | 1.67 |
| Idaho | 49 | $59,478 | $32,148 | 1.85 |
| Washington | 50 | $94,654 | $47,474 | 1.99 |