


Urban Interstates are major multi-lane highways in urbanized areas. The pavement condition of the urban Interstate system improved from 2022 to 2023, decreasing from 4.55% in poor condition to 4.53% (Table 12, Percent Urban Interstate Mileage in Poor Condition, 2023, Interstate highways were rated as poor, just below 2022’s numbers, the last time this assessment was completed.
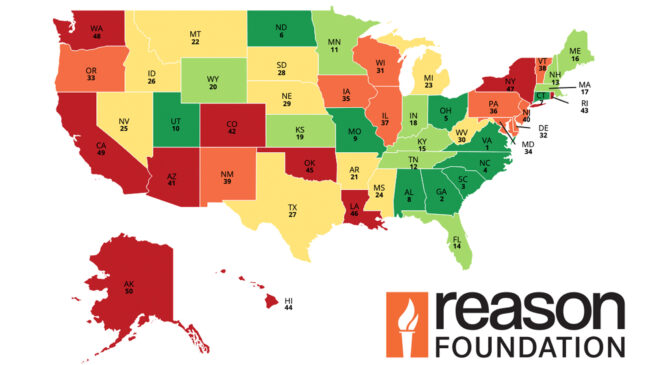
The condition of urban Interstate highways also varies widely by state. In 2023, New Hampshire was the only state to report no mileage in poor condition. Between 2022 and 2023, the percentage of poor urban Interstate mileage increased in 26 states, decreased in 23 states, and remained the same in one state. The percentage of poor mileage changed by less than one percentage point in 41 of the states. The bottom two states (Hawaii and Louisiana) continued to report more than 13% of their mileage to be in poor condition. These two states, collectively, only have 2.45% of the urban Interstate mileage in the U.S. (469 of 19,094 miles) but have over 7.5% of the mileage in poor condition (65 of 864 miles).
In 2023, New Hampshire, Maine, North Dakota, Vermont, and South Carolina had the lowest percent of urban Interstate pavement in poor condition. Hawaii, Louisiana, California, New York, and Delaware had the most. Compared to 2022, the states that decreased poor-condition miles the most were Hawaii, Nebraska, Delaware, Ohio, and Massachusetts (3.20%, 2.03%, 1.57%, 1.17% and 1.06% respetively). The states with the highest increase in poor-condition miles were Montana (1.53%), Arizona (1.26%), Iowa (1.10%), Wyoming (1.08%), and Rhode Island (0.98%).
29th Annual Highway Report: Percent Urban Interstate Mileage in Poor Condition, 2023
| State | Rank | Percent Urban Interstate Mileage in Poor Condition |
|---|---|---|
| New Hampshire | 1 | 0.10 |
| Maine | 2 | 0.64 |
| North Dakota | 3 | 0.65 |
| Vermont | 4 | 0.75 |
| South Carolina | 5 | 1.11 |
| Florida | 6 | 1.18 |
| Nebraska | 7 | 1.28 |
| Alaska | 8 | 1.35 |
| Idaho | 9 | 1.53 |
| Rhode Island | 10 | 1.56 |
| Connecticut | 11 | 1.58 |
| Tennessee | 12 | 1.59 |
| South Dakota | 13 | 1.60 |
| Georgia | 14 | 1.62 |
| Montana | 15 | 1.83 |
| Minnesota | 16 | 1.87 |
| Utah | 17 | 2.37 |
| Kansas | 18 | 2.49 |
| Oregon | 19 | 2.49 |
| Massachusetts | 20 | 2.56 |
| Virginia | 21 | 2.69 |
| Nevada | 22 | 2.69 |
| North Carolina | 23 | 2.72 |
| Arizona | 24 | 2.73 |
| Ohio | 25 | 2.98 |
| Indiana | 26 | 3.05 |
| Missouri | 27 | 3.21 |
| Washington | 28 | 3.65 |
| West Virginia | 29 | 3.77 |
| Alabama | 30 | 3.84 |
| New Mexico | 31 | 4.32 |
| Iowa | 32 | 4.32 |
| Texas | 33 | 4.52 |
| Illinois | 34 | 4.66 |
| Wisconsin | 35 | 4.70 |
| Kentucky | 36 | 4.77 |
| Mississippi | 37 | 4.84 |
| Arkansas | 38 | 5.18 |
| Oklahoma | 39 | 5.64 |
| Pennsylvania | 40 | 5.69 |
| Michigan | 41 | 6.16 |
| New Jersey | 42 | 6.25 |
| Maryland | 43 | 6.92 |
| Wyoming | 44 | 7.45 |
| Colorado | 45 | 7.47 |
| Delaware | 46 | 7.78 |
| New York | 47 | 8.84 |
| California | 48 | 10.16 |
| Louisiana | 49 | 13.49 |
| Hawaii | 50 | 16.35 |
| Average | NA | 4.53 |