


Introduction
Reason’s 27th Annual Highway Report rates state highway systems on cost versus quality using a method developed in the early 1990s by David T. Hartgen, Ph.D., who was emeritus professor at the University of North Carolina at Charlotte. This method has since been refined by Hartgen, M. Gregory Fields, Ph.D., Baruch Feigenbaum, and Truong Bui. Since states have different budgets, system sizes, and traffic and geographic circumstances, their comparative performance depends on both system performance and the resources available. To determine relative performance across the country, state highway system budgets (per mile of responsibility) are compared with system performance, state by state. States with high ratings typically have better-than-average system conditions (good for road users) along with relatively low per-mile expenditures (good for taxpayers).
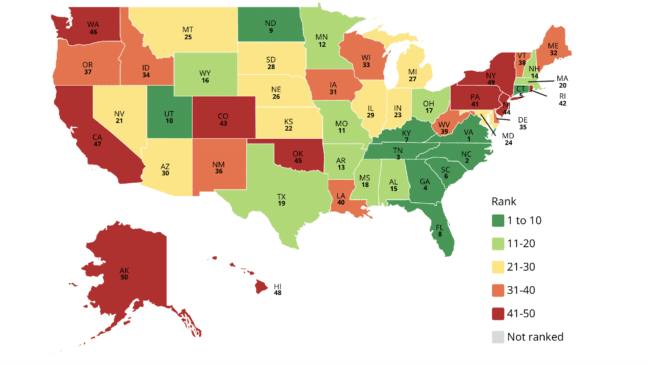
The following table shows the overall highway performance of the state highway systems using 2020 and 2021 data. This year’s leading states are Virginia, North Carolina, Tennessee, Georgia, and Connecticut. At the other end of the rankings are Alaska, New York, Hawaii, California, and Washington.
Similar to last year, the top-performing states are a mix of large and small states as well as states that are more urban and more rural (Tables 1, 2, 3, 4, and Figure 1). Five high-population states rank in the top 10 of the overall rankings: Virginia (1st), North Carolina (2nd), Tennessee (3rd), Georgia (4th), and Florida (8th). Numerous factors—terrain, climate, truck volumes, urbanization, system age, budget priorities, unit cost differences, state budget circumstances, and management/maintenance philosophies— all affect overall performance. Some categories in the report cannot be compared to previous years due to methodological changes that also impacted the overall rankings of some states. These methodological changes are fully explained in Part 2 and the appendix of this report. The remainder of this report reviews the statistics underlying these overall ratings in more detail.
27th Annual Highway Report: Each State’s Highway Performance Ranking By Category
| State | Overall | Capital & Bridge Disbursements Ratio | Maintenance Disbursements Ratio | Admin Disbursements Ratio | Other Disbursements Ratio | Rural Interstate Pavement Condition | Urban Interstate Pavement Condition | Rural Other Principal Arterial Pavement Condition | Urban Other Principal Arterial Pavement Condition | Urbanized Area Congestion | Structurally Deficient Bridges | Rural Fatality Rate | Urban Fatality Rate | Other Fatality Rate |
|---|---|---|---|---|---|---|---|---|---|---|---|---|---|---|
| Alabama | 15 | 27 | 4 | 42 | 22 | 28 | 36 | 6 | 2 | 10 | 9 | 36 | 38 | 24 |
| Alaska | 50 | 49 | 47 | 27 | 24 | 48 | 12 | 50 | 9 | 15 | 35 | 44 | 41 | 5 |
| Arizona | 30 | 46 | 10 | 43 | 44 | 34 | 14 | 27 | 17 | 27 | 1 | 41 | 48 | 18 |
| Arkansas | 13 | 15 | 6 | 2 | 11 | 37 | 35 | 37 | 27 | 25 | 20 | 18 | 7 | 8 |
| California | 47 | 36 | 44 | 31 | 41 | 46 | 47 | 42 | 50 | 44 | 25 | 39 | 23 | 38 |
| Colorado | 43 | 28 | 43 | 40 | 12 | 47 | 40 | 26 | 31 | 31 | 21 | 32 | 36 | 20 |
| Connecticut | 5 | 12 | 16 | 16 | 9 | 13 | 8 | 21 | 28 | 42 | 22 | 25 | 11 | 17 |
| Delaware | 35 | 10 | 38 | 49 | 25 | N/A | 44 | 16 | 11 | 43 | 4 | 38 | 43 | 25 |
| Florida | 8 | 43 | 29 | 28 | 20 | 1 | 9 | 2 | 4 | 18 | 8 | 45 | 49 | 15 |
| Georgia | 4 | 8 | 13 | 34 | 7 | 18 | 5 | 8 | 3 | 40 | 6 | 35 | 37 | 33 |
| Hawaii | 48 | 25 | 20 | 21 | 8 | N/A | 50 | 48 | 33 | 26 | 33 | 49 | 39 | 1 |
| Idaho | 34 | 48 | 33 | 22 | 32 | 32 | 11 | 46 | 34 | 7 | 19 | 43 | 3 | 16 |
| Illinois | 29 | 34 | 27 | 11 | 19 | 26 | 34 | 44 | 32 | 45 | 38 | 14 | 26 | 28 |
| Indiana | 23 | 37 | 48 | 15 | 6 | 39 | 31 | 7 | 18 | 22 | 24 | 37 | 24 | 10 |
| Iowa | 31 | 42 | 23 | 17 | 21 | 30 | 33 | 39 | 29 | 2 | 49 | 10 | 22 | 26 |
| Kansas | 22 | 13 | 22 | 25 | 48 | 14 | 25 | 5 | 20 | 37 | 17 | 30 | 27 | 41 |
| Kentucky | 7 | 14 | 19 | 1 | 26 | 16 | 16 | 14 | 6 | 19 | 26 | 24 | 40 | 48 |
| Louisiana | 40 | 6 | 18 | 4 | 17 | 43 | 49 | 43 | 40 | 23 | 45 | 20 | 46 | 47 |
| Maine | 32 | 23 | 39 | 7 | 23 | 27 | 7 | 47 | 30 | 8 | 44 | 8 | 4 | 32 |
| Maryland | 24 | 30 | 26 | 23 | 39 | 23 | 42 | 25 | 41 | 34 | 14 | 1 | 25 | 22 |
| Massachusetts | 20 | 3 | 14 | 32 | 18 | 20 | 23 | 29 | 47 | 48 | 37 | 15 | 8 | 2 |
| Michigan | 27 | 20 | 12 | 13 | 15 | 41 | 43 | 19 | 42 | 35 | 42 | 5 | 28 | 31 |
| Minnesota | 12 | 33 | 40 | 33 | 38 | 17 | 27 | 15 | 1 | 39 | 12 | 2 | 2 | 4 |
| Mississippi | 18 | 17 | 3 | 10 | 14 | 29 | 26 | 23 | 26 | 27 | 29 | 46 | 45 | 49 |
| Missouri | 11 | 2 | 15 | 14 | 30 | 9 | 24 | 12 | 23 | 38 | 39 | 17 | 42 | 30 |
| Montana | 25 | 32 | 34 | 20 | 33 | 25 | 13 | 36 | 38 | 3 | 28 | 47 | 14 | 45 |
| Nebraska | 26 | 24 | 41 | 6 | 28 | 10 | 29 | 34 | 48 | 8 | 36 | 28 | 17 | 19 |
| Nevada | 21 | 44 | 24 | 47 | 36 | 2 | 17 | 1 | 12 | 11 | 2 | 48 | 32 | 7 |
| New Hampshire | 14 | 19 | 30 | 45 | 34 | 6 | 1 | 22 | 13 | 21 | 34 | 3 | 1 | 14 |
| New Jersey | 44 | 45 | 42 | 35 | 40 | 24 | 46 | 41 | 45 | 50 | 31 | 13 | 18 | 3 |
| New Mexico | 36 | 7 | 1 | 48 | 27 | 40 | 28 | 31 | 36 | 16 | 18 | 31 | 50 | 36 |
| New York | 49 | 47 | 46 | 36 | 50 | 38 | 48 | 32 | 46 | 49 | 40 | 7 | 19 | 9 |
| North Carolina | 2 | 11 | 8 | 8 | 5 | 15 | 15 | 10 | 7 | 11 | 30 | 22 | 20 | 39 |
| North Dakota | 9 | 38 | 5 | 12 | 35 | 7 | 2 | 28 | 24 | 4 | 43 | 19 | 5 | 23 |
| Ohio | 17 | 16 | 7 | 37 | 16 | 33 | 32 | 17 | 39 | 30 | 16 | 11 | 15 | 27 |
| Oklahoma | 45 | 41 | 45 | 41 | 37 | 35 | 38 | 40 | 25 | 41 | 41 | 33 | 35 | 44 |
| Oregon | 37 | 39 | 35 | 39 | 49 | 11 | 21 | 20 | 22 | 33 | 13 | 42 | 33 | 43 |
| Pennsylvania | 41 | 21 | 37 | 38 | 43 | 42 | 39 | 33 | 35 | 32 | 46 | 9 | 29 | 35 |
| Rhode Island | 42 | 22 | 31 | 29 | 3 | 3 | 18 | 49 | 49 | 46 | 48 | 26 | 16 | 13 |
| South Carolina | 6 | 5 | 2 | 3 | 2 | 19 | 3 | 24 | 8 | 17 | 23 | 50 | 30 | 46 |
| South Dakota | 28 | 18 | 36 | 46 | 29 | 8 | 4 | 18 | 19 | 5 | 47 | 29 | 31 | 37 |
| Tennessee | 3 | 9 | 11 | 26 | 1 | 12 | 10 | 13 | 10 | 29 | 11 | 23 | 47 | 40 |
| Texas | 19 | 31 | 17 | 9 | 31 | 22 | 30 | 9 | 37 | 47 | 3 | 40 | 34 | 42 |
| Utah | 10 | 40 | 32 | 18 | 47 | 4 | 20 | 11 | 5 | 13 | 5 | 16 | 13 | 6 |
| Vermont | 38 | 35 | 49 | 50 | 45 | 21 | 6 | 38 | 21 | 19 | 7 | 6 | 12 | 12 |
| Virginia | 1 | 1 | 28 | 19 | 10 | 5 | 19 | 3 | 16 | 24 | 10 | 27 | 10 | 29 |
| Washington | 46 | 50 | 50 | 44 | 46 | 45 | 22 | 30 | 44 | 35 | 15 | 4 | 6 | 34 |
| West Virginia | 39 | 4 | 9 | 5 | 4 | 44 | 45 | 45 | 14 | 6 | 50 | 21 | 21 | 50 |
| Wisconsin | 33 | 29 | 21 | 30 | 42 | 36 | 37 | 35 | 43 | 13 | 27 | 12 | 9 | 21 |
| Wyoming | 16 | 26 | 25 | 24 | 13 | 31 | 41 | 4 | 15 | 1 | 32 | 34 | 44 | 11 |