


There is no universally accepted definition of traffic congestion. In reporting to the federal government, in the past the states have used peak-hour traffic volume-to-capacity (V/C) ratios, as calculated in the Transportation Research Board’s Highway Capacity Manual, as a congestion measure.
Through 2009, the Federal Highway Administration (FHWA) summed these V/C calculations to determine the state mileage in various V/C categories. Since 2009, however, these tables have not been published by FHWA. Instead, FHWA has been reporting periodic statistics based on travel delays from mobile devices, but only for selected regions and roads, not for states.
This year, the Annual Highway Report uses data from INRIX’s 2024 Global Traffic Scorecard, which uses 2023 congestion data. The metric selected was the “annual hours of delay per auto commuter.” INRIX defines annual delay per auto commuter as “a measure of the extra travel time endured throughout the year by auto commuters who make trips during the peak period.” The INRIX data, which are computed for urbanized areas, are aggregated by state. See the Appendix for details.
2023 Rank In 2023, the average annual hours of delay per auto commuter in urbanized areas was 35.22 hours, a decrease of 14.8% from 2022’s 41.33 hours (see Table 15, Annual Hours of Delay per Auto Commuter, Figure 10). Since 2014 congestion has decreased by 31.5%.
Cumulatively, commuters lose 3.6 million hours in urban congestion. We did not collect 2015 congestion data to compare to like the other sections, so 2014 was chosen to collect a larger sample of data. The congestion problem is primarily concentrated in the major cities of about 10 states.
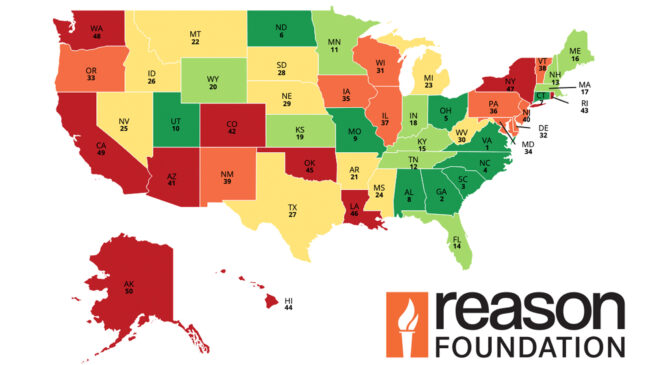
In 2023, Iowa, North Dakota, Kansas, Wyoming, and West Virginia reported the lowest urbanized area delay per auto commuter. New Jersey, Massachusetts, New York, Delaware, and California reported the most. Compared to 2022, the states whose ratio increased by the highest percentage were North Dakota, Idaho, Arkansas, Maine, and Mississippi (134%, 132%, 118%, 92%, and 90% respectively). The states that improved the most were Oregon (42%), Arizona (41%), Delaware (34%), Massachusetts (32%), and Louisiana (31%).
Commuters in the bottom three states (New Jersey, Massachusetts, and New York) spent more than 60 hours of delay per year in traffic congestion.
29th Annual Highway Report: Urbanized Area Traffic Congestion — Annual Peak Hours Spent in Congestion Per Commuter
| State | Rank | Peak Hours Spent in Congestion per Auto Commuter |
|---|---|---|
| Iowa | 1 | 9.8 |
| North Dakota | 2 | 9.9 |
| Kansas | 3 | 10.2 |
| Wyoming | 4 | 11.6 |
| West Virginia | 5 | 12.5 |
| Vermont | 6 | 12.5 |
| Montana | 7 | 12.6 |
| Maine | 8 | 12.8 |
| South Dakota | 9 | 13.0 |
| Alaska | 10 | 13.4 |
| Arizona | 11 | 13.8 |
| Mississippi | 12 | 13.9 |
| New Mexico | 13 | 14.2 |
| Alabama | 14 | 14.5 |
| Michigan | 15 | 14.6 |
| Oklahoma | 16 | 14.9 |
| Arkansas | 17 | 15.1 |
| Ohio | 18 | 15.9 |
| Utah | 19 | 16.2 |
| Hawaii | 20 | 16.5 |
| Wisconsin | 21 | 16.9 |
| Idaho | 22 | 17.3 |
| Nebraska | 23 | 17.4 |
| Minnesota | 24 | 17.7 |
| South Carolina | 25 | 21.6 |
| Missouri | 26 | 21.6 |
| Kentucky | 27 | 22.2 |
| Connecticut | 28 | 23.6 |
| Louisiana | 29 | 23.7 |
| North Carolina | 30 | 24.3 |
| Indiana | 31 | 24.4 |
| New Hampshire | 32 | 25.6 |
| Nevada | 33 | 25.8 |
| Oregon | 34 | 27.3 |
| Colorado | 35 | 28.1 |
| Tennessee | 36 | 30.2 |
| Rhode Island | 37 | 31.6 |
| Virginia | 38 | 32.8 |
| Washington | 39 | 33.8 |
| Florida | 40 | 37.0 |
| Texas | 41 | 37.1 |
| Pennsylvania | 42 | 38.5 |
| Maryland | 43 | 44.1 |
| Illinois | 44 | 45.9 |
| Georgia | 45 | 46.2 |
| California | 46 | 49.4 |
| Delaware | 47 | 54.8 |
| New York | 48 | 61.6 |
| Massachusetts | 49 | 64.4 |
| New Jersey | 50 | 84.8 |
| Average | NA | 35.22 |