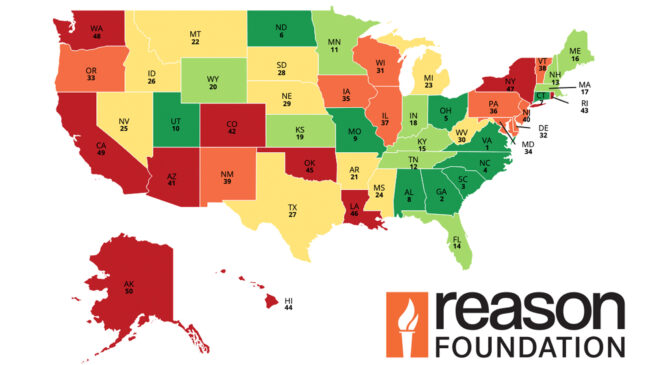


Urban other principal arterials (UOPA) are four- to eight-lane highways connecting different parts of an urban region. The condition of major urban arterials worsened slightly from 2022 to 2023, by about 0.12 percentage points. Overall, 13.07% of the UOPA system—8,224 miles out of 62,904—was reported to be in poor condition (Table 14, Percent Urban Other Principal Arterial Mileage compares with about 12.95% (906 of 90,315 miles) in 2022, the last time this assessment was completed. This bucks a steady long-term trend of improvement in UOPA pavement quality.
The percentage of UOPA increased in 26 states, decreased in 23 states and remained the same in one state. Thirteen states reported less than 5% of their UOPA mileage was in poor condition. On the other hand, four states (California, Nebraska, Rhode Island, and New York) reported more than 20% of their UOPA mileage was in poor condition. These four states have 15.88% of the U.S. ROPA mileage, but 36.09% of the mileage that is in poor condition.
In 2023, Alabama, Georgia, Minnesota, Indiana, and Florida reported the lowest percentage of poor UOPA mileage. California, Nebraska, Rhode Island, New York, and Massachusetts reported the highest percentage.
Compared to 2022, the states whose percentage increased the most were Idaho, Alabama, Minnesota, Utah, and South Dakota (136%, 63%, 28%, 26%, and 24% respectively.). The states that improved the most were Kentucky (40%), West Virginia (31%), New Hampshire (23%), Delaware (22%), and Massachusetts (14%).
29th Annual Highway Report: Percent Urban Other Principal Arterial Mileage in Poor Condition, 2023
| State | Rank | Percent Urban Other Principal Arterial Mileage in Poor Condition |
|---|---|---|
| Alabama | 1 | 1.70 |
| Georgia | 2 | 1.75 |
| Minnesota | 3 | 1.76 |
| Indiana | 4 | 2.05 |
| Florida | 5 | 2.48 |
| South Carolina | 6 | 2.76 |
| West Virginia | 7 | 3.39 |
| New Hampshire | 8 | 3.40 |
| Utah | 9 | 3.50 |
| Kentucky | 10 | 3.54 |
| Nevada | 11 | 4.77 |
| Delaware | 12 | 4.89 |
| Tennessee | 13 | 4.95 |
| North Carolina | 14 | 5.45 |
| Virginia | 15 | 5.95 |
| Alaska | 16 | 6.44 |
| Wyoming | 17 | 6.88 |
| South Dakota | 18 | 7.40 |
| Kansas | 19 | 7.48 |
| Arizona | 20 | 8.13 |
| Connecticut | 21 | 8.15 |
| Missouri | 22 | 8.38 |
| Oregon | 23 | 8.66 |
| North Dakota | 24 | 8.66 |
| Vermont | 25 | 8.84 |
| Iowa | 26 | 9.11 |
| Montana | 27 | 9.66 |
| Arkansas | 28 | 10.34 |
| Mississippi | 29 | 10.71 |
| Oklahoma | 30 | 11.14 |
| Maine | 31 | 11.23 |
| Idaho | 32 | 11.54 |
| Illinois | 33 | 11.62 |
| Michigan | 34 | 11.76 |
| Ohio | 35 | 12.71 |
| Colorado | 36 | 12.93 |
| Pennsylvania | 37 | 13.20 |
| New Mexico | 38 | 13.32 |
| Texas | 39 | 13.46 |
| Hawaii | 40 | 13.96 |
| New Jersey | 41 | 15.46 |
| Louisiana | 42 | 17.02 |
| Maryland | 43 | 17.34 |
| Washington | 44 | 19.08 |
| Wisconsin | 45 | 19.37 |
| Massachusetts | 46 | 19.74 |
| New York | 47 | 24.69 |
| Rhode Island | 48 | 27.16 |
| Nebraska | 49 | 28.31 |
| California | 50 | 32.35 |
| Average | NA | 13.07 |