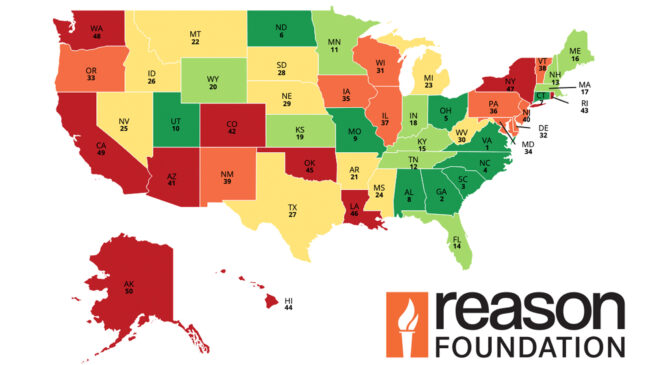


The urban fatality rate measures fatalities on all major urban arterials in the state. The nation’s urban highway fatality rate improved from 1.07 in 2022 to 1.00 in 2023 (Table 18, Fatality Rate per 100 Million Urban Vehicle-Miles, 2023, Figure 13). In 2023, 13,019 urban fatalities were reported, fewer than the 13,545 urban fatalities reported in 2022, as urban VMT (vehicle- miles of travel) increased from 1.26 trillion miles in 2022 to 1.3 trillion miles in 2023.
Seventeen states reported an increase in their urban fatality rate compared to 2022, led by Wyoming (1.00 points), West Virginia (0.37 points), and Idaho (0.35 points). No states had rates that remained the same. Indiana (0.66 points), Arkansas (0.37 points), and Virginia (0.37 points). Thirty-three states reported decreases in their urban fatality rate compared to 2022, led by Alaska (1.20 points), Indiana (0.66 points), Arkansas (0.37 points), and Virginia (0.37 points).
In 2023, Minnesota, North Dakota, Massachusetts, New Hampshire, and Wisconsin reported the lowest urban fatality rate. New Mexico, Wyoming, Mississippi, Tennessee, and Florida reported the highest. Compared to 2022, the states whose ratios increased by the highest percentage were Wyoming, Idaho, West Virginia, Rhode Island, respectively). The states that improved the most were Alaska (64%), Indiana (45%), Virginia (38%), Nebraska (34%), and Kansas (32%).
| State | Rank | Fatality Rate Per 100 Million Vehicles-Miles |
|---|---|---|
| Minnesota | 1 | 0.38 |
| North Dakota | 2 | 0.48 |
| Massachusetts | 3 | 0.50 |
| New Hampshire | 4 | 0.52 |
| Wisconsin | 5 | 0.58 |
| Virginia | 6 | 0.60 |
| Vermont | 7 | 0.60 |
| Kansas | 8 | 0.62 |
| Maine | 9 | 0.62 |
| South Dakota | 10 | 0.66 |
| Alaska | 11 | 0.67 |
| Utah | 12 | 0.68 |
| Nebraska | 13 | 0.69 |
| New Jersey | 14 | 0.70 |
| Connecticut | 15 | 0.76 |
| North Carolina | 16 | 0.77 |
| New York | 17 | 0.80 |
| Ohio | 18 | 0.80 |
| Indiana | 19 | 0.81 |
| Rhode Island | 20 | 0.82 |
| Pennsylvania | 21 | 0.92 |
| Michigan | 22 | 0.92 |
| Illinois | 23 | 0.93 |
| Iowa | 24 | 0.95 |
| Idaho | 25 | 0.99 |
| Texas | 26 | 1.02 |
| California | 27 | 1.02 |
| Alabama | 28 | 1.02 |
| Delaware | 29 | 1.06 |
| Missouri | 30 | 1.06 |
| Washington | 31 | 1.07 |
| Maryland | 32 | 1.12 |
| Louisiana | 33 | 1.13 |
| West Virginia | 34 | 1.13 |
| Arkansas | 35 | 1.14 |
| Oregon | 36 | 1.17 |
| Georgia | 37 | 1.18 |
| Nevada | 38 | 1.19 |
| Colorado | 39 | 1.19 |
| Hawaii | 40 | 1.21 |
| South Carolina | 41 | 1.23 |
| Kentucky | 42 | 1.28 |
| Arizona | 43 | 1.29 |
| Oklahoma | 44 | 1.32 |
| Montana | 45 | 1.35 |
| Florida | 46 | 1.40 |
| Tennessee | 47 | 1.50 |
| Mississippi | 48 | 1.63 |
| Wyoming | 49 | 1.81 |
| New Mexico | 50 | 2.09 |
| Average | NA | 1.00 |