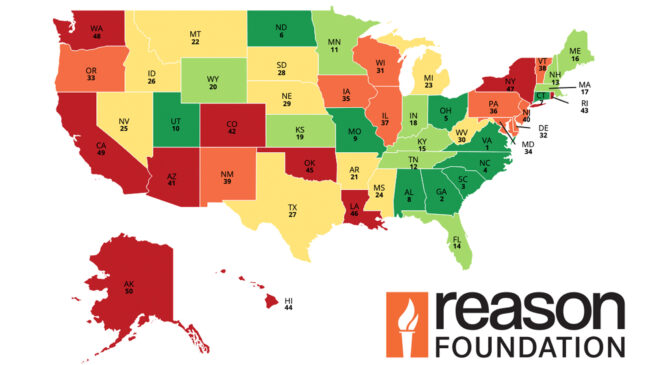


The other fatality rate measures fatalities on rural and urban minor arterials, collectors, and local roadways in the state as fatalities per 100 million vehicle- miles. The nation’s other highway fatality rate improved from 1.56 per 100 million urban vehicle-miles in 2022 to 1.49 per 100 million urban vehicle-miles in 2023 (Table 19, Fatality Rate per 100 Million Other Vehicle-Miles, 2023, Figure 14). In 2023, 21,305 other fatalities were reported, fewer than the 22,098 other fatalities reported in 2022.
Fifteen states reported an increase in their other fatality rate compared to 2022, led by Rhode Island (0.55 points), Mississippi (0.47 points), and Idaho (0.31 points). Thirty-five states saw their fatality rate decrease, led by Wyoming (0.43 points), Louisiana (0.38 points), and New Mexico (0.28 points).
In 2023, Hawaii, Massachusetts, Utah, New Jersey, and Alaska reported the lowest other fatality rate. Kentucky, West Virginia, Arizona, Mississippi, and South Carolina reported the highest. Compared to 2022, the states whose ratio increased by the highest percentage were Rhode Island, Mississippi, Indiana, Idaho, and respectively). The states that improved the most were Wyoming (29%), Utah (22%), Maine (19%), Massachusetts (19%), and Louisiana (18%).
29th Annual Highway Report: Other Highway Fatality Rate (Per 100 Million Vehicle-Miles Traveled)
| State | Rank | Fatality Rate Per 100 Million Vehicles-Miles |
|---|---|---|
| Hawaii | 1 | 0.57 |
| Massachusetts | 2 | 0.66 |
| Utah | 3 | 0.82 |
| New Jersey | 4 | 0.84 |
| Alaska | 5 | 0.89 |
| Minnesota | 6 | 0.91 |
| Wisconsin | 7 | 1.03 |
| Wyoming | 8 | 1.04 |
| New York | 9 | 1.07 |
| Vermont | 10 | 1.08 |
| Indiana | 11 | 1.14 |
| North Dakota | 12 | 1.17 |
| Maine | 13 | 1.19 |
| Maryland | 14 | 1.21 |
| Rhode Island | 15 | 1.23 |
| Missouri | 16 | 1.23 |
| New Hampshire | 17 | 1.32 |
| Nebraska | 18 | 1.35 |
| Iowa | 19 | 1.35 |
| Florida | 20 | 1.35 |
| Michigan | 21 | 1.36 |
| New Mexico | 22 | 1.37 |
| Connecticut | 23 | 1.38 |
| Georgia | 24 | 1.40 |
| Alabama | 25 | 1.40 |
| Virginia | 26 | 1.41 |
| Ohio | 27 | 1.47 |
| Colorado | 28 | 1.48 |
| Nevada | 29 | 1.48 |
| Illinois | 30 | 1.49 |
| Kansas | 31 | 1.50 |
| Montana | 32 | 1.50 |
| North Carolina | 33 | 1.57 |
| Idaho | 34 | 1.63 |
| Delaware | 35 | 1.64 |
| Pennsylvania | 36 | 1.64 |
| Arkansas | 37 | 1.67 |
| Washington | 38 | 1.67 |
| California | 39 | 1.71 |
| Louisiana | 40 | 1.73 |
| Oregon | 41 | 1.83 |
| Tennessee | 42 | 1.87 |
| Texas | 43 | 1.90 |
| South Dakota | 44 | 1.93 |
| Oklahoma | 45 | 2.00 |
| South Carolina | 46 | 2.02 |
| Mississippi | 47 | 2.03 |
| Arizona | 48 | 2.04 |
| West Virginia | 49 | 2.09 |
| Kentucky | 50 | 2.34 |
| Average | NA | 1.49 |