


Other disbursements include funds for law enforcement, safety, bonds, and interest payments. Since they include interest payments, they can vary widely from year to year. Other disbursements comprise about 22.2% billion in 2023, about the same as the this assessment was completed. In 2019, we measured other disbursements per lane-mile. For 2018, we measured other disbursements per centerline-mile, lane-mile, and vehicle-miles traveled (VMT) per lane-mile. This year, we measured other disbursements per lane-mile adjusted for urbanization, the same process that we used the past two years. For this process, we take the disbursement per lane-mile and divide it by the expected disbursement per lane-mile to calculate a ratio.
The average 2023 per lane-mile Other Disbursements per State, 2023, last time this assessment was completed. This change contrasts with an increasing spending trend over the last decade. This is likely the result of some states reclassifying certaint types of disbursements.
Since 2015, total other disbursements have decreased about 2.3%, while the Consumer Price Index (CPI) rose about 28% in that time period.
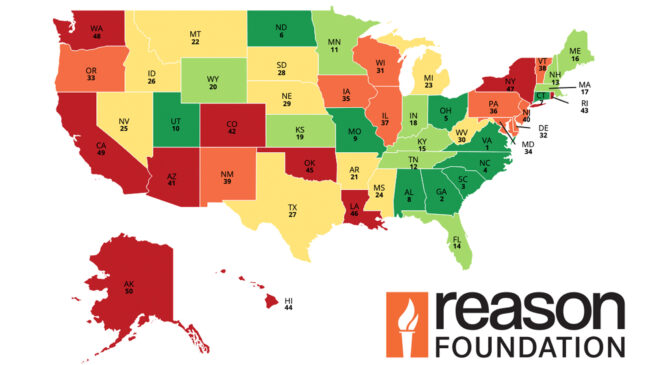
In 2023, South Carolina, Tennessee, Indiana, Virginia, and Alabama reported the lowest other expenditure disbursement ratios after adjusting for urbanization. Washington, New York, California, Wisconsin, and Vermont reported the highest expenditure ratios. Compared to 2022, the states whose ratios worsened by the highest percent were North Carolina, New York, North Dakota, Utah, and Wisconsin (200%, 69%, 55%, 54%, 51%). The states that improved the most were Alabama (81%), New Hampshire (60%), Georgia (47%), Louisiana (46%), and Indiana (45%). Some of the other disbursements per state-controlled lane-mile can vary widely from year to year reflecting funding actions and project schedules.
29th Annual Highway Report: Other Disbursements
| State | Rank | Disbursement Per Lane-Mile | Average/Expected Value | Relative Score |
|---|---|---|---|---|
| South Carolina | 1 | $432 | $22,656 | 0.02 |
| Tennessee | 2 | $1,130 | $25,987 | 0.04 |
| Indiana | 3 | $4,133 | $15,937 | 0.26 |
| Virginia | 4 | $5,606 | $15,916 | 0.35 |
| Alabama | 5 | $6,150 | $17,422 | 0.35 |
| Hawaii | 6 | $26,652 | $69,414 | 0.38 |
| Georgia | 7 | $12,015 | $30,364 | 0.40 |
| West Virginia | 8 | $3,438 | $7,994 | 0.43 |
| North Carolina | 9 | $6,399 | $14,163 | 0.45 |
| Massachusetts | 10 | $139,184 | $296,382 | 0.47 |
| Rhode Island | 11 | $60,234 | $126,411 | 0.48 |
| Mississippi | 12 | $5,118 | $10,364 | 0.49 |
| Florida | 13 | $44,370 | $82,334 | 0.54 |
| Wyoming | 14 | $3,360 | $5,780 | 0.58 |
| Maine | 15 | $5,135 | $8,443 | 0.61 |
| Nebraska | 16 | $3,121 | $5,098 | 0.61 |
| Ohio | 17 | $19,355 | $30,975 | 0.62 |
| Colorado | 18 | $10,338 | $15,599 | 0.66 |
| Iowa | 19 | $6,840 | $10,002 | 0.68 |
| New Hampshire | 20 | $9,102 | $13,259 | 0.69 |
| Michigan | 21 | $24,367 | $35,229 | 0.69 |
| Connecticut | 22 | $114,522 | $160,237 | 0.71 |
| Delaware | 23 | $31,688 | $43,884 | 0.72 |
| Kentucky | 24 | $6,736 | $9,159 | 0.74 |
| South Dakota | 25 | $2,303 | $3,085 | 0.75 |
| Arkansas | 26 | $8,354 | $10,988 | 0.76 |
| Missouri | 27 | $7,428 | $9,180 | 0.81 |
| Alaska | 28 | $7,703 | $9,332 | 0.83 |
| North Dakota | 29 | $2,409 | $2,836 | 0.85 |
| Montana | 30 | $2,925 | $3,263 | 0.90 |
| New Mexico | 31 | $6,480 | $7,127 | 0.91 |
| Illinois | 32 | $34,182 | $36,816 | 0.93 |
| Louisiana | 33 | $15,341 | $15,936 | 0.96 |
| Texas | 34 | $15,647 | $15,944 | 0.98 |
| Nevada | 35 | $14,244 | $12,395 | 1.15 |
| Arizona | 36 | $19,182 | $16,133 | 1.19 |
| Oregon | 37 | $16,979 | $12,840 | 1.32 |
| Minnesota | 38 | $17,197 | $12,586 | 1.37 |
| Pennsylvania | 39 | $14,586 | $10,221 | 1.43 |
| New Jersey | 40 | $519,641 | $337,403 | 1.54 |
| Utah | 41 | $27,786 | $16,806 | 1.65 |
| Maryland | 42 | $95,566 | $56,525 | 1.69 |
| Idaho | 43 | $13,270 | $7,191 | 1.85 |
| Oklahoma | 44 | $19,626 | $10,442 | 1.88 |
| Kansas | 45 | $15,117 | $7,782 | 1.94 |
| Vermont | 46 | $14,268 | $7,336 | 1.94 |
| Wisconsin | 47 | $33,087 | $15,617 | 2.12 |
| California | 48 | $85,392 | $39,775 | 2.15 |
| New York | 49 | $95,886 | $37,795 | 2.54 |
| Washington | 50 | $72,494 | $20,408 | 3.55 |
| Total | NA | NA | NA | NA |
| Average | NA | NA | NA | NA |