


Reason Foundation’s Annual Highway Report tracks the performance of the 50 state highway systems. Each state’s overall rating is determined by rankings in 13 categories, including highway expenditures per mile, Interstate and primary road pavement conditions, urbanized area congestion, bridge conditions, and fatality rates. The report is based on spending and performance data state highway agencies submitted to the federal government, supplemented by data from the National Bridge Inventory and INRIX.
The report evaluates a state’s highway system spending and the condition of its roadways. The most effective and efficient state systems have low average per-mile spending and smooth pavement condition, structurally sound bridges, limited traffic congestion, and low fatality rates. But performing well in each category is challenging. Many states with low overall spending and acceptable conditions rank well as do states with above-average spending and outstanding conditions. Table ES1 summarizes recent nationwide system trends for key indicators. The U.S. saw system improvements in some categories from 2020 to 2023, but declines in several other categories.
Between 2022 and 2023, three of the four disbursement measures (capital and bridge, maintenance, and administrative) for the U.S. state-owned highway system worsened (states spent more money on their highway systems in 2023 than in 2022). The other disbursement measures improved from the previous report. Seven of the nine performance measures improved, including urban Interstate pavement condition, rural other arterial pavement condition, urban other arterial pavement condition, structurally deficient bridges, rural fatality rate, urban fatality rate, and other fatality rate. Two of the nine performance measures worsened: rural Interstate pavement condition and urbanized area congestion.
Overall, states are spending more money for a better quality, safer roadway system.
29th Annual Highway Report: Table ES1: Performance of State-Owned Highway Systems, 2020-2023
| Statistic | 2020 | 2022 | 2023 | Percent change 2022-2023 | Percent change 2020-2023 |
|---|---|---|---|---|---|
| Mileage Under State Control (Thousands) | 868 | 782 | 823 | 5.24% | -5.18% |
| Disbursements per Lane-Mile, Capital/Bridges, $ | $41,783 | $43,674 | $47,332 | 8.38% | 13.28% |
| Disbursements per Lane-Mile, Maintenance, $ | $14,546 | $14,819 | $15,382 | 3.80% | 5.75% |
| Disbursements per Lane-Mile, Administration, $ | $5,432 | $6,308 | $6,788 | 7.61% | 24.96% |
| Disbursements per Lane-Mile, Other $ | $21,908 | $20,430 | $19,928 | -2.46% | 9.04% |
| Consumer Price Index (1983=$1.00) | $2.64 | $2.87 | $3.06 | 6.62% | 15.90% |
| Rural Interstate, Percent Poor Condition | 2.09 | 2.03 | 2.19 | 7.88% | 4.78% |
| Urban Interstate, Percent Poor Condition | 4.77 | 4.55 | 4.53 | -0.44% | -5.03% |
| Rural Other Principal Arterial, Percent Poor Condition | 1.13 | 1.00 | 1.09 | -9.00% | 3.54% |
| Urban Other Principal Arterial, Percent Poor Condition | 14.19 | 12.95 | 13.07 | -9.27% | 7.89% |
| Urbanized Area Congestion | 21.93 | 41.33 | 35.2 | 14.83% | -60.51% |
| Structurally Deficient Bridges, Poor Condition | 7.02 | 6.9 | 6.80 | -1.45% | -3.13% |
| Rural Fatality Rate per 100 Million Vehicle-Miles, All Arterials | 1.3 | 1.25 | 1.18 | -5.60% | -9.23% |
| Urban Fatality Rate per 100 Million Vehicle-Miles, All Arterials | 1.04 | 1.07 | 1.00 | 6.54% | 3.85% |
| Other Fatality Rate per 100 Million Vehicle-Miles | 1.54 | 1.56 | 1.49 | 4.49% | 3.25% |
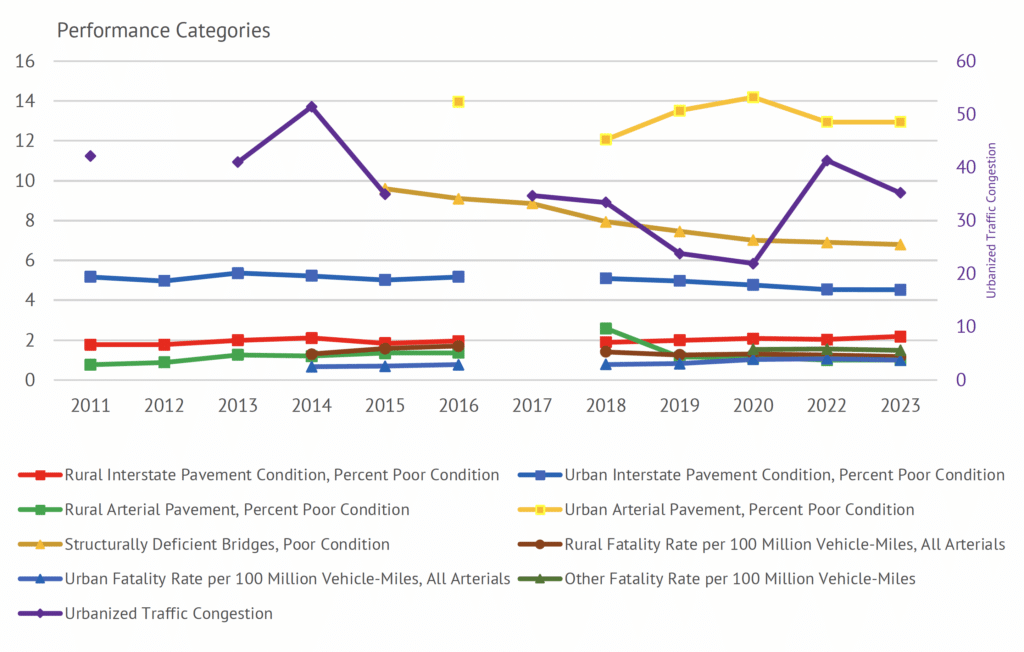
Table ES2 summarizes system trends over the past 10 years.
Over a 10-year period, disbursements increased, pavement quality improved, congestion improved (on a statewide basis), the percentage of structurally deficient bridges decreased, and the fatality rate decreased.
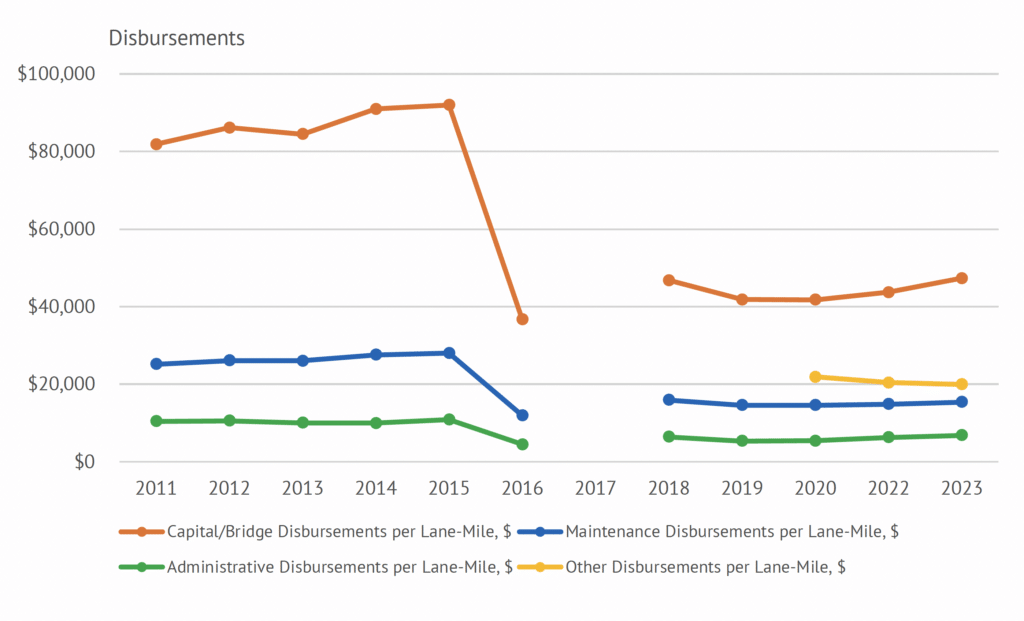
Figure ES1 displays these data points in a graph.
29th Annual Highway Report: Table ES2: Trends in Highway System Performance, 2011-2023
| Statistic | 2011 | 2012 | 2013 | 2014 | 2015 | 2016 | 2017 | 2018 | 2019 | 2020 | 2022 | 2023 |
|---|---|---|---|---|---|---|---|---|---|---|---|---|
| Mileage Under State Control (Thousands) | 814 | 814 | 815 | 817 | 814 | 837 | N/A | 857 | 781 | 868 | 782 | 823 |
| Other Disbursements per Lane-Mile, $ | N/A | N/A | N/A | N/A | N/A | N/A | N/A | N/A | N/A | $21,908 | $20,430 | $47,332 |
| Disbursements per Lane-Mile, Capital/Bridges, $ | $81,844* | $86,153* | $84,494* | $90,969* | $91,992* | $36,681 | N/A | $46,805 | $41,850 | $41,783 | $43,674 | $15,382 |
| Disbursements per Lane-Mile, Maintenance, $ | $25,129* | $26,079* | $25,996* | $27,559* | $28,020* | $11,929 | N/A | $15,952 | $14,570 | $14,546 | $14,819 | $6,788 |
| Disbursements per Lane-Mile, Administration, $ | $10,430* | $10,579* | $10,051* | $ 9,980* | $10,864* | $4,501 | N/A | $6,443 | $5,351 | $5,432 | $6,308 | $19,928 |
| Consumer Price Index (1983=1.00) | $2.25 | $2.32 | $2.35 | $2.39 | $2.39 | $2.42 | $2.48 | $2.53 | $2.57 | $2.64 | $2.87 | $3.06 |
| Rural Interstate, Percent Poor Condition | 1.78* | 1.78* | 2.00* | 2.11* | 1.85* | 1.96 | N/A | 1.89 | 2 | 2.09 | 2.03 | 2.19 |
| Urban Interstate, Percent Poor Condition | 5.18* | 4.97* | 5.37* | 5.22* | 5.02* | 5.18 | N/A | 5.1 | 4.97 | 4.77 | 4.55 | 4.53 |
| Rural Other Principal Arterial, Percent Poor Condition | 0.77* | 0.89* | 1.27* | 1.20* | 1.35* | 1.36 | N/A | 2.59 | 1.15 | 1.13 | 1 | 1.00 |
| Urban Other Principal Arterial, Percent Poor Condition | N/A | N/A | N/A | N/A | N/A | 13.97 | N/A | 12.06 | 13.52 | 14.19 | 12.95 | 13.07 |
| Urbanized Area Congestion | 42.15** | N/A | 40.99** | 51.40** | 34.95** | N/A | 34.7 | 33.43 | 23.83** | 21.93** | 41.33 | 35.2 |
| Structurally Deficient Bridges, Poor Condition | N/A | N/A | N/A | N/A | 9.60* | 9.1 | 8.86 | 7.94 | 7.46 | 7.02 | 6.9 | 6.80 |
| Other Fatality Rate per 100 Million Vehicle-Miles | N/A | N/A | N/A | N/A | N/A | N/A | N/A | N/A | N/A | 1.54 | 1.56 | 1.18 |
| Rural Fatality Rate per 100 Million Vehicle-Miles, All Arterials | N/A | N/A | N/A | 1.30* | 1.58* | 1.71 | N/A | 1.42 | 1.26 | 1.3 | 1.25 | 1.00 |
| Urban Fatality Rate per 100 Million Vehicle-Miles, All Arterials | N/A | N/A | N/A | 0.67* | 0.70* | 0.77 | N/A | 0.78 | 0.82 | 1.04 | 1.07 | 1.49 |
*State-controlled miles were used from 2008 to 2015. From 2016 to 2022 state-controlled lane-miles were used
**A different congestion metric was used for these years
Figure ES1: Trends in Highway System Performance
The top-performing states tend to be a mix of high-population and low-population states that lean both urban and rural. Very rural, low-population states may have had a slight advantage before 2019. But since the report changed to using expected disbursements and ratios, that advantage no longer exists. Four of the top five states are among the top 15 states in population. Low-population-density states such as Alabama and high-population- density states such as Connecticut both rank in the top 10.
States that struggle also have differing characteristics. The bottom five states include very rural, low-population Alaska, rural Louisiana, and two states with larger urbanized areas: California and Washington.
Several states had large increases or decreases in their ratings. Massachusetts’ ranking improved by 23 spots. However, the rankings for Arizona and Idaho both worsened by at least 10 spots.
Certain states spend significantly more than the national average. This spending may be justified if these states perform well in other categories. Unfortunately, some of the states that spend the most money are the worst performers:
- For capital and bridge disbursements, six states have per-mile ratios higher than 1.5: Washington, Alaska, Idaho, Kansas, Indiana, and New York.
- For maintenance disbursements, five states have per-mile ratios higher than 2.0: Washington, Indiana, Oklahoma, Vermont, and New York.
- For administrative disbursements, six states have per-mile ratios higher than 2.0: Vermont, Nevada, Arizona, New Mexico, Delaware, and New Hampshire.
- For other disbursements, four states have per-mile ratios higher than 2.0: Washington, New York, California, and Wisconsin.
System performance problems in each measured category seem to be concentrated in a handful of states:
- Approximately 44% of the rural Interstate mileage in poor condition is in just four states: Alaska, California, Colorado, and Arizona.
- Approximately 8% of the urban Interstate mileage in poor condition is in just two states: Hawaii and Louisiana.
- Approximately 6% of the rural arterial mileage in poor condition is located in Alaska alone.
- Almost 40% of the urban arterial primary mileage in poor condition is in just four states: California, Nebraska, Rhode Island, and New York.
- Automobile commuters in eight states spend more than 40 hours annually stuck in California, Georgia, Illinois, and Maryland.
- Although a majority of states saw the percentage of structurally deficient bridges decline, nine states report more than 10% of their bridges as structurally deficient: West Virginia, Iowa, South Dakota, Rhode Island, Maine, Pennsylvania, Louisiana, Michigan, and North Dakota.
- Three states have rural fatality rates of 1.80 per 100 million vehicle-miles traveled or higher: Alaska, South Carolina, and Hawaii.
- Twenty-five states have urban fatality rates of 1.0 per 100 million vehicle-miles traveled or higher: New Mexico, Wyoming, Mississippi, Tennessee, Florida, Montana, Oklahoma, Arizona, Kentucky, South Carolina, Hawaii, Colorado, Nevada, Georgia, Oregon, Arkansas, West Virginia, Louisiana, Maryland, Washington, Missouri, Delaware, Alabama, California, and Texas.
- Twenty states have other fatality rates of 1.5 per 100 million vehicle-miles traveled or higher: Kentucky, West Virginia, Arizona, Mississippi, South Carolina, Oklahoma, South Dakota, Texas, Tennessee, Oregon, Louisiana, California, Washington, Arkansas, Pennsylvania, Delaware, Idaho, North Carolina, Montana, and Kansas.
System performance improved for some states but declined for others this year, with slightly less than half of the states (21 of 50) making progress, a similar number (23 of 50) regressing, and the rest remaining the same between 2022 and 2023.
The 10-year average of state overall performance data shows that most state highway systems are improving over time. System performance problems are concentrated in a handful of states. These states are finding it difficult to improve. There is also increasing evidence that higher-level highway systems (Interstates, other freeways, and principal arterials) are in better shape than lower-level highway systems, particularly local roads.
29th Annual Highway Report: Each State’s Highway Performance Ranking By Category
| State | Overall | Capital & Bridge Disbursements Ratio | Maintenance Disbursements Ratio | Admin Disbursements Ratio | Other Disbursements Ratio | Rural Interstate Pavement Condition | Urban Interstate Pavement Condition | Rural Arterial Pavement Condition | Urban Arterial Pavement Condition | Urbanized Area Congestion | Structurally Deficient Bridges | Rural Fatality Rate | Urban Fatality Rate | Other Fatality Rate |
|---|---|---|---|---|---|---|---|---|---|---|---|---|---|---|
| Virginia | 1 | 2 | 26 | 10 | 4 | 11 | 21 | 11 | 15 | 38 | 10 | 29 | 6 | 26 |
| Georgia | 2 | 11 | 13 | 24 | 7 | 16 | 14 | 3 | 2 | 45 | 5 | 23 | 37 | 24 |
| South Carolina | 3 | 1 | 3 | 4 | 1 | 28 | 5 | 21 | 6 | 25 | 24 | 49 | 41 | 46 |
| North Carolina | 4 | 8 | 7 | 3 | 9 | 20 | 23 | 20 | 14 | 30 | 33 | 31 | 16 | 33 |
| Ohio | 5 | 10 | 6 | 30 | 17 | 19 | 25 | 9 | 35 | 18 | 14 | 6 | 18 | 27 |
| North Dakota | 6 | 30 | 8 | 9 | 29 | 7 | 3 | 23 | 24 | 2 | 42 | 26 | 2 | 12 |
| Connecticut | 7 | 19 | 11 | 16 | 22 | 1 | 11 | 32 | 21 | 28 | 18 | 18 | 15 | 23 |
| Alabama | 8 | 13 | 1 | 41 | 5 | 32 | 30 | 5 | 1 | 14 | 8 | 44 | 28 | 25 |
| Missouri | 9 | 3 | 10 | 5 | 27 | 23 | 27 | 13 | 22 | 26 | 40 | 15 | 30 | 16 |
| Utah | 10 | 33 | 38 | 20 | 41 | 8 | 17 | 10 | 9 | 19 | 6 | 22 | 12 | 3 |
| Minnesota | 11 | 32 | 43 | 32 | 38 | 9 | 16 | 22 | 3 | 24 | 11 | 5 | 1 | 6 |
| Tennessee | 12 | 17 | 17 | 23 | 2 | 14 | 12 | 27 | 13 | 36 | 12 | 20 | 47 | 42 |
| New Hampshire | 13 | 18 | 27 | 45 | 20 | 5 | 1 | 14 | 8 | 32 | 34 | 9 | 4 | 17 |
| Florida | 14 | 43 | 34 | 19 | 13 | 2 | 6 | 7 | 5 | 40 | 9 | 32 | 46 | 20 |
| Kentucky | 15 | 15 | 23 | 1 | 24 | 24 | 36 | 15 | 10 | 27 | 32 | 11 | 42 | 50 |
| Maine | 16 | 22 | 37 | 11 | 15 | 3 | 2 | 41 | 31 | 8 | 46 | 3 | 9 | 13 |
| Massachusetts | 17 | 6 | 15 | 38 | 10 | 36 | 20 | 17 | 46 | 49 | 38 | 2 | 3 | 2 |
| Indiana | 18 | 46 | 49 | 17 | 3 | 38 | 26 | 4 | 4 | 31 | 21 | 27 | 19 | 11 |
| Kansas | 19 | 47 | 21 | 34 | 45 | 13 | 18 | 8 | 19 | 3 | 20 | 28 | 8 | 31 |
| Wyoming | 20 | 24 | 28 | 13 | 14 | 27 | 44 | 1 | 17 | 4 | 28 | 46 | 49 | 8 |
| Arkansas | 21 | 23 | 5 | 6 | 26 | 40 | 38 | 25 | 28 | 17 | 22 | 45 | 35 | 37 |
| Montana | 22 | 16 | 36 | 28 | 30 | 29 | 15 | 26 | 27 | 7 | 31 | 43 | 45 | 32 |
| Michigan | 23 | 39 | 19 | 12 | 21 | 39 | 41 | 16 | 34 | 15 | 43 | 7 | 22 | 21 |
| Mississippi | 24 | 21 | 2 | 8 | 12 | 34 | 37 | 34 | 29 | 12 | 26 | 37 | 48 | 47 |
| Nevada | 25 | 36 | 31 | 49 | 35 | 10 | 22 | 2 | 11 | 33 | 2 | 40 | 38 | 29 |
| Idaho | 26 | 48 | 35 | 14 | 43 | 22 | 9 | 19 | 32 | 22 | 19 | 35 | 25 | 34 |
| Texas | 27 | 34 | 22 | 37 | 34 | 21 | 33 | 12 | 39 | 41 | 3 | 42 | 26 | 43 |
| South Dakota | 28 | 25 | 40 | 44 | 25 | 4 | 13 | 18 | 18 | 9 | 48 | 19 | 10 | 44 |
| Nebraska | 29 | 26 | 30 | 25 | 16 | 12 | 7 | 44 | 49 | 23 | 35 | 13 | 13 | 18 |
| West Virginia | 30 | 4 | 16 | 7 | 8 | 35 | 29 | 36 | 7 | 5 | 50 | 30 | 34 | 49 |
| Wisconsin | 31 | 28 | 14 | 22 | 47 | 26 | 35 | 40 | 45 | 21 | 29 | 14 | 5 | 7 |
| Delaware | 32 | 5 | 39 | 46 | 23 | N/A | 46 | 6 | 12 | 47 | 4 | 41 | 29 | 35 |
| Oregon | 33 | 40 | 41 | 40 | 37 | 15 | 19 | 24 | 23 | 34 | 15 | 47 | 36 | 41 |
| Maryland | 34 | 20 | 32 | 36 | 42 | 30 | 43 | 30 | 43 | 43 | 13 | 1 | 32 | 14 |
| Iowa | 35 | 42 | 24 | 26 | 19 | 33 | 32 | 38 | 26 | 1 | 49 | 17 | 24 | 19 |
| Pennsylvania | 36 | 7 | 20 | 15 | 39 | 41 | 40 | 37 | 37 | 42 | 45 | 8 | 21 | 36 |
| Illinois | 37 | 35 | 18 | 27 | 32 | 25 | 34 | 46 | 33 | 44 | 41 | 25 | 23 | 30 |
| Vermont | 38 | 37 | 47 | 50 | 46 | 18 | 4 | 43 | 25 | 6 | 7 | 10 | 7 | 10 |
| New Mexico | 39 | 12 | 4 | 47 | 31 | 42 | 31 | 35 | 38 | 13 | 17 | 38 | 50 | 22 |
| New Jersey | 40 | 44 | 42 | 31 | 40 | 17 | 42 | 31 | 41 | 50 | 27 | 16 | 14 | 4 |
| Arizona | 41 | 29 | 12 | 48 | 36 | 45 | 24 | 42 | 20 | 11 | 1 | 39 | 43 | 48 |
| Colorado | 42 | 27 | 33 | 33 | 18 | 46 | 45 | 33 | 36 | 35 | 16 | 33 | 39 | 28 |
| Rhode Island | 43 | 31 | 29 | 18 | 11 | 6 | 10 | 49 | 48 | 37 | 47 | 4 | 20 | 15 |
| Hawaii | 44 | 9 | 9 | 29 | 6 | N/A | 50 | 48 | 40 | 20 | 30 | 48 | 40 | 1 |
| Oklahoma | 45 | 38 | 48 | 42 | 44 | 31 | 39 | 45 | 30 | 16 | 36 | 24 | 44 | 45 |
| Louisiana | 46 | 14 | 25 | 2 | 33 | 44 | 49 | 47 | 42 | 29 | 44 | 21 | 33 | 40 |
| New York | 47 | 45 | 46 | 43 | 49 | 37 | 47 | 28 | 47 | 48 | 39 | 12 | 17 | 9 |
| Washington | 48 | 50 | 50 | 39 | 50 | 43 | 28 | 29 | 44 | 39 | 23 | 34 | 31 | 38 |
| California | 49 | 41 | 44 | 35 | 48 | 47 | 48 | 39 | 50 | 46 | 25 | 36 | 27 | 39 |
| Alaska | 50 | 49 | 45 | 21 | 28 | 48 | 8 | 50 | 16 | 10 | 37 | 50 | 11 | 5 |
Figure ES2 shows each state’s ranking based on 2023 data.