


Key Findings of Reason Foundation’s 29th Annual Highway Report
Virginia, Georgia, South Carolina, North Carolina, and Ohio have the best-performing, most cost-effective roads and bridges, according to Reason Foundation’s 29th Annual Highway Report.
Alaska, California, Washington, New York, and Louisiana have the worst-performing and least cost-effective highway systems, the study finds. Alaska ranked last overall for the second consecutive report, posting the worst rural fatality rate in the nation. California ranked 49th, with the worst urban arterial pavement condition. Washington finished 48th overall while ranking as the highest-spending state in multiple categories.
Massachusetts recorded the largest improvement in the nation, rising 23 spots from 40th to 17th. Arizona went in the opposite direction, falling 12 spots, from 29th to 41st, after significant declines in urban interstate and rural arterial pavement quality.
Traffic Fatalities
Twenty-five states recorded urban fatality rates at or above 1.0 per 100 million vehicle-miles. The states with the highest urban fatality rates were New Mexico, Wyoming, Mississippi, Tennessee, and Florida. Maryland posted the nation’s lowest rural fatality rate, Alaska the highest.
Pavement Conditions
Urban interstate pavement conditions improved slightly nationwide. Hawaii and Louisiana ranked at the bottom, each reporting more than 13% of their urban interstate pavement in poor condition, followed by California (10%) and New York (9%).
Several states are failing to maintain urban arterial roads. California, Nebraska, Rhode Island, and New York collectively account for nearly 40% of all urban arterial mileage rated poor nationwide, with California reporting 32.35% of its urban arterial mileage in poor condition.
Connecticut, Florida, and Maine reported the best rural interstate pavement quality. Meanwhile, four states, Alaska, California, Colorado, and Arizona, account for 44% of all poor-condition rural interstate mileage despite having only about 12.5% of total rural interstate mileage.
Structurally Deficient Bridges
More than 42,000 of the nation’s 618,923 highway bridges, nearly 7%, are still structurally deficient. Arizona, Nevada, and Texas reported the lowest percentages of deficient bridges.
Nine states have more than 10% of bridges rated structurally deficient: West Virginia, Iowa, South Dakota, Rhode Island, Maine, Pennsylvania, Louisiana, Michigan, and North Dakota.
Traffic Congestion
Commuters in New Jersey, Massachusetts, and New York lose more than 60 hours a year to traffic jams, the worst in the nation. Drivers in Delaware, California, Georgia, Illinois and Maryland also lost over 40 hours to traffic congestion.
Overview of the Annual Highway Report
Reason Foundation’s 29th Annual Highway Report evaluates state highway systems on cost versus quality using a method developed in the early 1990s by David T. Hartgen, Ph.D., emeritus professor at the University of North Carolina at Charlotte. This method has since been refined by Hartgen, M. Gregory Fields, Ph.D., Baruch Feigenbaum, and Truong Bui.
Since states have different budgets, system sizes, and traffic and geographic circumstances, their comparative performance depends on both system performance and the resources available. To determine relative performance across the country, state highway system budgets (per mile of responsibility) are compared with system performance, state by state. States with high rankings typically have better-than-average system conditions (good for road users) along with relatively low per-mile expenditures (good for taxpayers).
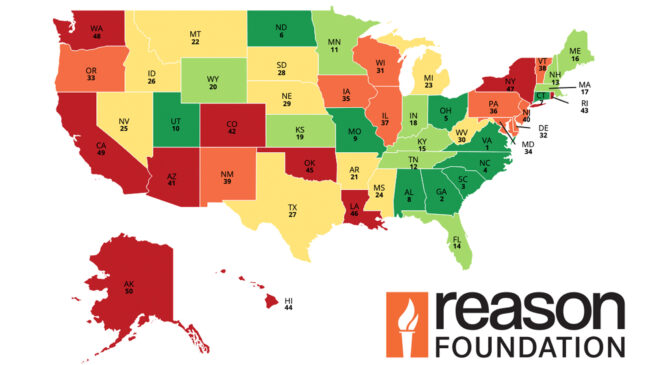
The following table shows the overall highway performance of the state highway systems using 2023 data. This year’s leading states are Virginia, Georgia, South Carolina, North Carolina, and Ohio. At the other end of the rankings are Alaska, California, Washington, New York, and Louisiana.
Similar to last year, the top-performing states are a mix of large and small states, as well as states that are more urban and more rural. (Tables 1, 2, 3, 4, and Figure 1).
Four large-population (more than seven million people) states place in the top five of the overall rankings: Virginia (1st), Georgia (2nd), North Carolina (4th), and Ohio (5th).
Numerous factors—terrain, climate, truck volumes, urbanization, system age, budget priorities, unit cost differences, state budget circumstances, and management/maintenance philosophies—all affect overall performance. The remainder of this report reviews the statistics underlying these overall rankings in more detail.
The overall rankings are not dramatically different from the previous version of the Annual Highway Report. However, one state’s overall ranking improved by double digits, while two states’ overall rankings declined by 10 or more spots:
- Massachusetts improved 23 positions from 40th to 17th in the overall rankings, as the state made double-digit improvements in multiple categories. Maintenance disbursements improved by 26 positions, rural arterial pavement condition improved by 14 positions, and rural fatality rate improved by 22 positions.
- Arizona worsened by 12 positions from 29th to 41st in the overall rankings, as two of the four pavement categories worsened significantly. Urban Interstate pavement worsened by 12 positions and rural arterial pavement condition worsened by 12 positions.
- Idaho worsened 11 positions from 15th to 26th in the overall rankings, as the state decreased by double-digits in five categories. Urban arterial pavement condition worsened by 20 positions, urban area congestion worsened by 15 positions, rural fatality rate worsened by 12 positions, urban fatality rate worsened by 20 positions, and other fatality rate worsened by 19 positions. The state has bounced around in the rankings as its pavement conditions and fatality rate have varied year to year more than most other states.
29th Annual Highway Report: Each State’s Highway Performance Ranking By Category
| State | Overall | Capital & Bridge Disbursements Ratio | Maintenance Disbursements Ratio | Admin Disbursements Ratio | Other Disbursements Ratio | Rural Interstate Pavement Condition | Urban Interstate Pavement Condition | Rural Arterial Pavement Condition | Urban Arterial Pavement Condition | Urbanized Area Congestion | Structurally Deficient Bridges | Rural Fatality Rate | Urban Fatality Rate | Other Fatality Rate |
|---|---|---|---|---|---|---|---|---|---|---|---|---|---|---|
| Virginia | 1 | 2 | 26 | 10 | 4 | 11 | 21 | 11 | 15 | 38 | 10 | 29 | 6 | 26 |
| Georgia | 2 | 11 | 13 | 24 | 7 | 16 | 14 | 3 | 2 | 45 | 5 | 23 | 37 | 24 |
| South Carolina | 3 | 1 | 3 | 4 | 1 | 28 | 5 | 21 | 6 | 25 | 24 | 49 | 41 | 46 |
| North Carolina | 4 | 8 | 7 | 3 | 9 | 20 | 23 | 20 | 14 | 30 | 33 | 31 | 16 | 33 |
| Ohio | 5 | 10 | 6 | 30 | 17 | 19 | 25 | 9 | 35 | 18 | 14 | 6 | 18 | 27 |
| North Dakota | 6 | 30 | 8 | 9 | 29 | 7 | 3 | 23 | 24 | 2 | 42 | 26 | 2 | 12 |
| Connecticut | 7 | 19 | 11 | 16 | 22 | 1 | 11 | 32 | 21 | 28 | 18 | 18 | 15 | 23 |
| Alabama | 8 | 13 | 1 | 41 | 5 | 32 | 30 | 5 | 1 | 14 | 8 | 44 | 28 | 25 |
| Missouri | 9 | 3 | 10 | 5 | 27 | 23 | 27 | 13 | 22 | 26 | 40 | 15 | 30 | 16 |
| Utah | 10 | 33 | 38 | 20 | 41 | 8 | 17 | 10 | 9 | 19 | 6 | 22 | 12 | 3 |
| Minnesota | 11 | 32 | 43 | 32 | 38 | 9 | 16 | 22 | 3 | 24 | 11 | 5 | 1 | 6 |
| Tennessee | 12 | 17 | 17 | 23 | 2 | 14 | 12 | 27 | 13 | 36 | 12 | 20 | 47 | 42 |
| New Hampshire | 13 | 18 | 27 | 45 | 20 | 5 | 1 | 14 | 8 | 32 | 34 | 9 | 4 | 17 |
| Florida | 14 | 43 | 34 | 19 | 13 | 2 | 6 | 7 | 5 | 40 | 9 | 32 | 46 | 20 |
| Kentucky | 15 | 15 | 23 | 1 | 24 | 24 | 36 | 15 | 10 | 27 | 32 | 11 | 42 | 50 |
| Maine | 16 | 22 | 37 | 11 | 15 | 3 | 2 | 41 | 31 | 8 | 46 | 3 | 9 | 13 |
| Massachusetts | 17 | 6 | 15 | 38 | 10 | 36 | 20 | 17 | 46 | 49 | 38 | 2 | 3 | 2 |
| Indiana | 18 | 46 | 49 | 17 | 3 | 38 | 26 | 4 | 4 | 31 | 21 | 27 | 19 | 11 |
| Kansas | 19 | 47 | 21 | 34 | 45 | 13 | 18 | 8 | 19 | 3 | 20 | 28 | 8 | 31 |
| Wyoming | 20 | 24 | 28 | 13 | 14 | 27 | 44 | 1 | 17 | 4 | 28 | 46 | 49 | 8 |
| Arkansas | 21 | 23 | 5 | 6 | 26 | 40 | 38 | 25 | 28 | 17 | 22 | 45 | 35 | 37 |
| Montana | 22 | 16 | 36 | 28 | 30 | 29 | 15 | 26 | 27 | 7 | 31 | 43 | 45 | 32 |
| Michigan | 23 | 39 | 19 | 12 | 21 | 39 | 41 | 16 | 34 | 15 | 43 | 7 | 22 | 21 |
| Mississippi | 24 | 21 | 2 | 8 | 12 | 34 | 37 | 34 | 29 | 12 | 26 | 37 | 48 | 47 |
| Nevada | 25 | 36 | 31 | 49 | 35 | 10 | 22 | 2 | 11 | 33 | 2 | 40 | 38 | 29 |
| Idaho | 26 | 48 | 35 | 14 | 43 | 22 | 9 | 19 | 32 | 22 | 19 | 35 | 25 | 34 |
| Texas | 27 | 34 | 22 | 37 | 34 | 21 | 33 | 12 | 39 | 41 | 3 | 42 | 26 | 43 |
| South Dakota | 28 | 25 | 40 | 44 | 25 | 4 | 13 | 18 | 18 | 9 | 48 | 19 | 10 | 44 |
| Nebraska | 29 | 26 | 30 | 25 | 16 | 12 | 7 | 44 | 49 | 23 | 35 | 13 | 13 | 18 |
| West Virginia | 30 | 4 | 16 | 7 | 8 | 35 | 29 | 36 | 7 | 5 | 50 | 30 | 34 | 49 |
| Wisconsin | 31 | 28 | 14 | 22 | 47 | 26 | 35 | 40 | 45 | 21 | 29 | 14 | 5 | 7 |
| Delaware | 32 | 5 | 39 | 46 | 23 | N/A | 46 | 6 | 12 | 47 | 4 | 41 | 29 | 35 |
| Oregon | 33 | 40 | 41 | 40 | 37 | 15 | 19 | 24 | 23 | 34 | 15 | 47 | 36 | 41 |
| Maryland | 34 | 20 | 32 | 36 | 42 | 30 | 43 | 30 | 43 | 43 | 13 | 1 | 32 | 14 |
| Iowa | 35 | 42 | 24 | 26 | 19 | 33 | 32 | 38 | 26 | 1 | 49 | 17 | 24 | 19 |
| Pennsylvania | 36 | 7 | 20 | 15 | 39 | 41 | 40 | 37 | 37 | 42 | 45 | 8 | 21 | 36 |
| Illinois | 37 | 35 | 18 | 27 | 32 | 25 | 34 | 46 | 33 | 44 | 41 | 25 | 23 | 30 |
| Vermont | 38 | 37 | 47 | 50 | 46 | 18 | 4 | 43 | 25 | 6 | 7 | 10 | 7 | 10 |
| New Mexico | 39 | 12 | 4 | 47 | 31 | 42 | 31 | 35 | 38 | 13 | 17 | 38 | 50 | 22 |
| New Jersey | 40 | 44 | 42 | 31 | 40 | 17 | 42 | 31 | 41 | 50 | 27 | 16 | 14 | 4 |
| Arizona | 41 | 29 | 12 | 48 | 36 | 45 | 24 | 42 | 20 | 11 | 1 | 39 | 43 | 48 |
| Colorado | 42 | 27 | 33 | 33 | 18 | 46 | 45 | 33 | 36 | 35 | 16 | 33 | 39 | 28 |
| Rhode Island | 43 | 31 | 29 | 18 | 11 | 6 | 10 | 49 | 48 | 37 | 47 | 4 | 20 | 15 |
| Hawaii | 44 | 9 | 9 | 29 | 6 | N/A | 50 | 48 | 40 | 20 | 30 | 48 | 40 | 1 |
| Oklahoma | 45 | 38 | 48 | 42 | 44 | 31 | 39 | 45 | 30 | 16 | 36 | 24 | 44 | 45 |
| Louisiana | 46 | 14 | 25 | 2 | 33 | 44 | 49 | 47 | 42 | 29 | 44 | 21 | 33 | 40 |
| New York | 47 | 45 | 46 | 43 | 49 | 37 | 47 | 28 | 47 | 48 | 39 | 12 | 17 | 9 |
| Washington | 48 | 50 | 50 | 39 | 50 | 43 | 28 | 29 | 44 | 39 | 23 | 34 | 31 | 38 |
| California | 49 | 41 | 44 | 35 | 48 | 47 | 48 | 39 | 50 | 46 | 25 | 36 | 27 | 39 |
| Alaska | 50 | 49 | 45 | 21 | 28 | 48 | 8 | 50 | 16 | 10 | 37 | 50 | 11 | 5 |