Jordan Campbell
Managing Director, Government Finance, Reason Foundation
Jordan Campbell is managing director of government finance and senior quantitative analyst at Reason Foundation.
Prior to joining Reason, Campbell worked at a marketing analytics firm building econometric models. Before starting his analytics career, he was a policy and research assistant at the Charles Koch Institute.
Campbell’s work has been published by The Press-Enterprise and the Platte Institute. His quantitative work on educational policy has been cited by The Thomas B. Fordham Institute.
Recently, Campbell appeared on a panel entitled “Don’t Fence Me In: Texans Crossing School Boundaries” sponsored by the Texas Public Policy Foundation.
Campbell received his bachelor’s degree from Portland State University and a master’s degree in quantitative economics from California Lutheran University.
He lives with his wife in Los Angeles.
-

Taxation by citation: A 50-state data and policy report on local government fines and forfeitures
This report maps the scope of local governments' dependence on fines and forfeitures to fund basic operations and why decades of reform efforts have fallen short.
-

Proposed pension benefit increases for first responders would burden California’s local governments and taxpayers
A bill currently under consideration in the California legislature would grant additional pension benefits to the state’s police officers and firefighters.
-
While losing 34% of its students, LAUSD’s spending on compensation increased by $1.7 billion
The school district's largest increase in compensation spending, about $315 million, went to administrative positions, not teachers.
-
How Connecticut’s pre-K endowment raises pension costs
Connecticut remains the second most indebted state in the nation on a per-capita basis, leaving little margin for deviation from its commitment to debt reduction.
-
Debt-ridden San Diego can no longer afford to subsidize the arts
San Diego is facing a $146 million budget deficit, so Mayor Todd Gloria’s proposed budget must cut spending.
-
CalPERS Monitor: How the pension system piled up debt and could add more
The California Public Employees' Retirement System has $179 billion in unfunded liabilities.
-
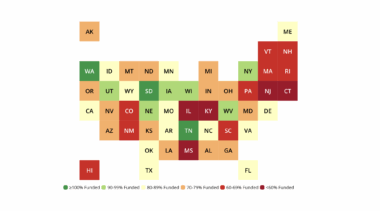
How every state’s public pension system ranks
Tennessee, Virginia, and Washington lead the nation with fully funded systems, while Illinois, Kentucky, and New Jersey remain at the bottom with the deepest shortfalls.
-
Why teacher salaries are stagnant
That teachers’ wages have stagnated over two decades of growth in public school funding highlights deep structural problems in K–12 finance.
-
State and local governments are drowning in debt
To address this mountain of debt and restore fiscal stability, state and local governments must sustainably align spending with revenues.
-
K-12 Education Spending Spotlight 2025: Annual public school spending nears $1 trillion
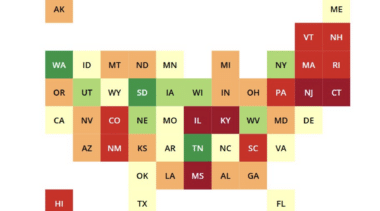
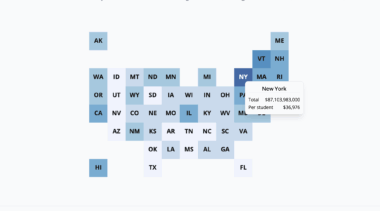
Eight states spend more than $25,000 per student: New York, New Jersey, Vermont, Connecticut, Pennsylvania, California, Rhode Island and Hawaii. Public school enrollment fell in 39 states from 2020 to 2023.
-
Report: Cities have $1.4 trillion in debt
San Francisco, Nantucket, New York City, Ocean City, and Miami Beach are the cities with the most per capita debt.
-
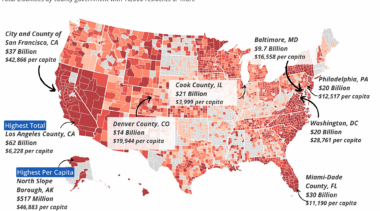
Report: County governments have $757 billion in debt
In per capita terms, North Slope Borough, Alaska, ranks first, with its total debt representing $46,883 per county resident.
-
Study: Illinois, Connecticut, Alaska, Hawaii, New Jersey and Mississippi have the most per capita pension debt
Illinois, Kentucky, New Jersey, Mississippi, and Connecticut have less than 60% of funding needed to pay for promised pension benefits.
-
The public pension plans with the most debt, best and worst investment return rates
The Maryland and Massachusetts teachers' retirement plans saw the largest growth in debt, the Fire Fighters' Relief and Retirement Fund of Austin posted the worst returns and the Miami General Employees and Sanitation Employees Plan had the highest return rate.
-
Report: State and local pension plans have $1.48 trillion in debt
State pension systems have $1.29 trillion in unfunded liabilities, and local governments have $187 billion.
-
Report ranks every state’s debt, from California’s $497 billion to South Dakota’s $2 billion
Study finds state governments have a total of $2.7 trillion in debt, with 26 states exceeding $20 billion in debt each and 10 states over $70 billion.
-
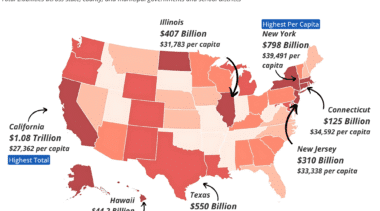
Report: State and local governments have $6.1 trillion in debt
State and local debt is over $100 billion in 16 states and exceeds $50 billion in 27 states. California’s state and local governments have over $1 trillion in debt.
-
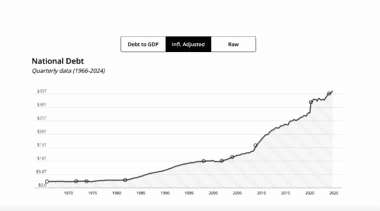
Debtor Nation 2025
At $36 trillion, the United States' debt-to-GDP ratio now exceeds 120%, surpassing the peak reached after World War II.