Jordan Campbell
Managing Director, Government Finance, Reason Foundation
Jordan Campbell is managing director of government finance and senior quantitative analyst at Reason Foundation.
Prior to joining Reason, Campbell worked at a marketing analytics firm building econometric models. Before starting his analytics career, he was a policy and research assistant at the Charles Koch Institute.
Campbell’s work has been published by The Press-Enterprise and the Platte Institute. His quantitative work on educational policy has been cited by The Thomas B. Fordham Institute.
Recently, Campbell appeared on a panel entitled “Don’t Fence Me In: Texans Crossing School Boundaries” sponsored by the Texas Public Policy Foundation.
Campbell received his bachelor’s degree from Portland State University and a master’s degree in quantitative economics from California Lutheran University.
He lives with his wife in Los Angeles.
-

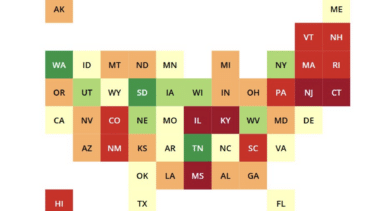
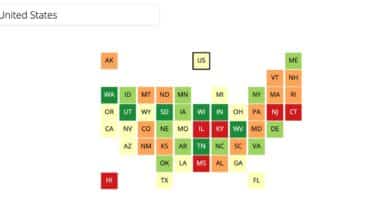
How every state’s public pension system ranks
Tennessee, Virginia, and Washington lead the nation with fully funded systems, while Illinois, Kentucky, and New Jersey remain at the bottom with the deepest shortfalls.
-

Why teacher salaries are stagnant
That teachers’ wages have stagnated over two decades of growth in public school funding highlights deep structural problems in K–12 finance.
-

State and local governments are drowning in debt
To address this mountain of debt and restore fiscal stability, state and local governments must sustainably align spending with revenues.
-
K-12 Education Spending Spotlight 2025: Annual public school spending nears $1 trillion
Eight states spend more than $25,000 per student: New York, New Jersey, Vermont, Connecticut, Pennsylvania, California, Rhode Island and Hawaii. Public school enrollment fell in 39 states from 2020 to 2023.
-
Report: Cities have $1.4 trillion in debt
San Francisco, Nantucket, New York City, Ocean City, and Miami Beach are the cities with the most per capita debt.
-
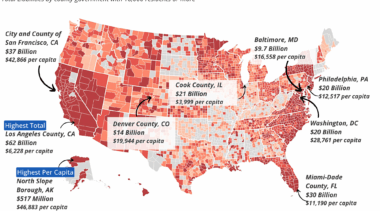
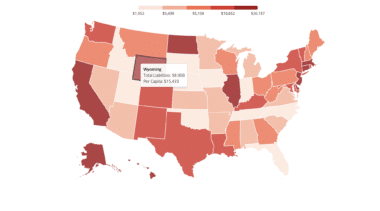
Report: County governments have $757 billion in debt
In per capita terms, North Slope Borough, Alaska, ranks first, with its total debt representing $46,883 per county resident.
-
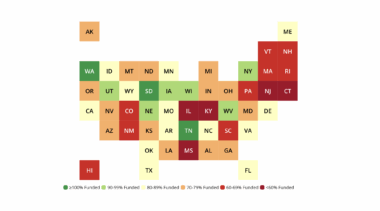
Study: Illinois, Connecticut, Alaska, Hawaii, New Jersey and Mississippi have the most per capita pension debt
Illinois, Kentucky, New Jersey, Mississippi, and Connecticut have less than 60% of funding needed to pay for promised pension benefits.
-
The public pension plans with the most debt, best and worst investment return rates
The Maryland and Massachusetts teachers' retirement plans saw the largest growth in debt, the Fire Fighters' Relief and Retirement Fund of Austin posted the worst returns and the Miami General Employees and Sanitation Employees Plan had the highest return rate.
-
Report: State and local pension plans have $1.48 trillion in debt
State pension systems have $1.29 trillion in unfunded liabilities, and local governments have $187 billion.
-
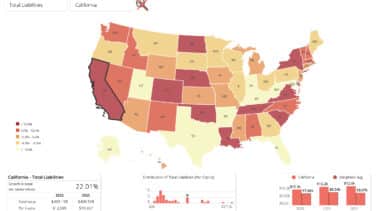
Report ranks every state’s debt, from California’s $497 billion to South Dakota’s $2 billion
Study finds state governments have a total of $2.7 trillion in debt, with 26 states exceeding $20 billion in debt each and 10 states over $70 billion.
-
Report: State and local governments have $6.1 trillion in debt
State and local debt is over $100 billion in 16 states and exceeds $50 billion in 27 states. California’s state and local governments have over $1 trillion in debt.
-
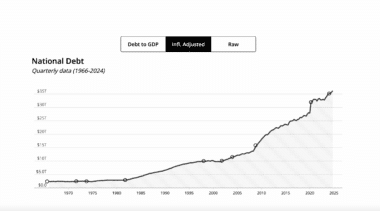
Debtor Nation 2025
At $36 trillion, the United States' debt-to-GDP ratio now exceeds 120%, surpassing the peak reached after World War II.
-
Examining the latest K-12 public school enrollment data and trends
Nationwide, public school enrollment has fallen by 1.28 million students since the start of COVID-19.
-
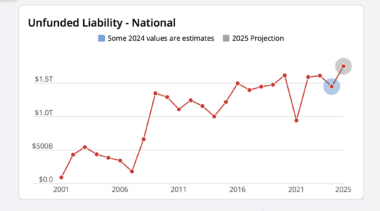
With additional plans reporting, total unfunded public pension liabilities in the U.S. grow to $1.61 trillion
Information added to the Annual Pension Solvency and Performance Report finds the median funded ratio across public pension plans decreased marginally to 75.8%.
-
Public school closures were on the upswing in 2024
In the 15 states examined, public school closures increased in 2023-24.
-
Debt trends for state and local governments 2020-2022
This tool provides debt and spending insights for the 100 largest municipalities, counties and school districts in America and all 50 states for fiscal years 2020, 2021 and 2022.
-
City debt: New York has more than four times the liabilities of Chicago, Los Angeles, Houston and other cities
New York City, the District of Columbia, Chicago, Atlanta, Yonkers and Austin have the most per capita liabilities.
-
County debt: Los Angeles, Miami-Dade and Cook counties among worst in nation
Los Angeles County had $54 billion in liabilities at the end of 2022. Miami-Dade County had $29 billion in total liabilities.