Carter Langofer
Government Finance and Economic Policy Analyst, Reason Foundation
Carter Langhofer is a government finance and economic policy analyst at Reason Foundation.
Prior to his employment, he attended Patrick Henry College and graduated with a degree in Economics and Business Analytics in May, 2024. During his time at Patrick Henry College, Carter participated in national security special projects, forensic events like Mock Trial, and interned at a variety of companies from law firms to investment firms. Planning to attend law school in the near future, Carter hopes to build his economic analysis and writing skills at Reason Foundation before pursuing his dream career of being a federal judge.
While not at work, Carter is a passionate piano player and an avid Kansas City Chiefs fan, as he is originally from Wichita, Kansas.
-
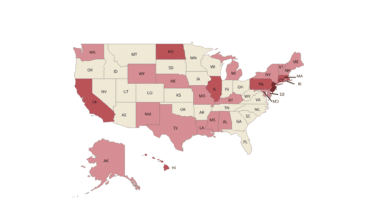
State and local government finances in America: A comprehensive analysis of debt and liquidity
Based on audited financial reports from more than 20,000 government entities, this study uses eight objective indicators to identify emerging fiscal risks.
-
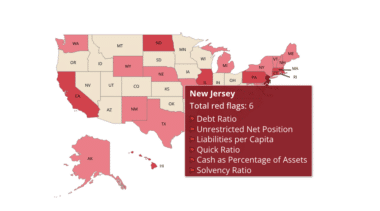
Study: New Jersey and Connecticut are the most financially distressed states
New Jersey has the most financial red flags, followed by Connecticut, California, Hawaii, Illinois, Massachusetts, North Dakota and Pennsylvania. Twenty-three states have zero red flags.
-

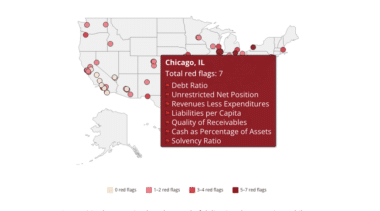
Study: Chicago and New York City are the most fiscally stressed cities in the nation
While Chicago and New York face extreme pressure on nearly every metric, 42 of the 100 most populous cities trigger one or fewer red flags.
-
Study: Nassau County and Miami-Dade are the nation’s most fiscally-stressed counties
Westchester County (NY), Prince George’s County (MD), Jefferson County (AL), Denton County (TX), and Baltimore County (MD) also have significant fiscal red flags.
-
Study: Fort Bend (TX) and Gwinnett County (GA) are the most fiscally stressed school districts in the nation
School districts in Chicago, Denver, Frisco, and Omaha also have significant fiscal red flags.
-
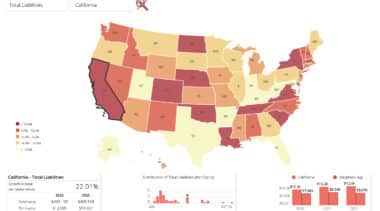
Debt trends for state and local governments 2020-2022
This tool provides debt and spending insights for the 100 largest municipalities, counties and school districts in America and all 50 states for fiscal years 2020, 2021 and 2022.