

Executive summary
Beneath the surface of America’s bustling cities, suburbs, and school systems lies a story of growing concern—one of mounting fiscal pressures that threaten the long-term delivery of public services. While local needs naturally differ across urban transit hubs, rural fire districts, and suburban communities, repeated spending that outpaces revenues creates dangerous imbalances. Over time, these imbalances erode reserves, pile up debt, and risk service interruptions, tax hikes, or prolonged decline that could result in the death of a city.
To cut through the complexity, this report delivers an objective analysis of financial health across America’s largest state and local governments. Using Reason Foundation’s unique database, compiled from the audited annual comprehensive financial reports of more than 20,000 local government entities, the analysis applies eight standardized financial metrics to assess both long-term solvency and short-term liquidity. Entities that exceed the objective standard on any metric are awarded a “red flag,” indicating a concerning trend.
A single red flag does not necessarily portend an immediate fiscal crisis, but each one signals structural weaknesses that deserve urgent attention.
A combination of multiple red flags may indicate an entity is in a precarious financial position in both the short and long term.
These eight objective metrics include:
Long-term indicators
- Debt Ratio (total liabilities ÷ total assets): Entities should not hold more debt than assets.
- Unrestricted Net Position: Negative values indicate insufficient discretionary resources.
- Revenues Less Expenditures: Spending in excess of revenues leads to a deterioration of the balance sheet.
- Liabilities per Capita: Liabilities exceeding $10,000 per resident (or $20,000 per student for school districts) become increasingly difficult for taxpayers to service.
Short-term indicators
- Quick Ratio: Entities should hold at least enough liquid assets to cover bills scheduled to fall due over the next year.
- Quality of Receivables: If receivables are valued at greater than 30% of annual revenues, the entity may be experiencing difficulty collecting its assessments.
- Cash as Percentage of Assets: Holding less than 10% of assets as cash leaves governments vulnerable to cash crunches.
- Solvency Ratio (liabilities ÷ annual revenues): If liabilities are greater than double annual revenues, the entity’s ability to issue new debt may be limited, and taxpayers may have difficulty servicing debt.
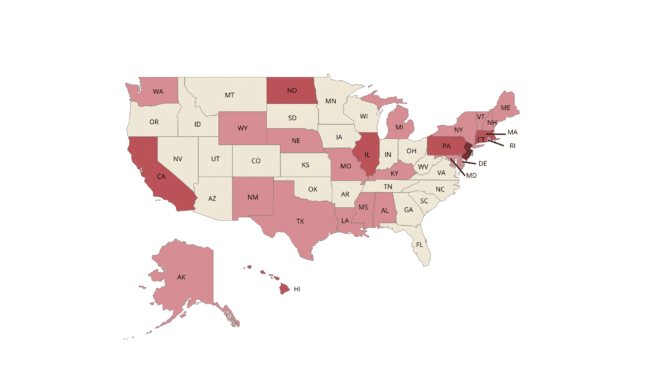
These uniform tests reveal striking differences in how governments manage their finances. At the state level, a clear divide emerges wherein Northeastern and Pacific states often struggle under the weight of legacy pension shortfalls, generous benefits, and spending growth that exceeds revenue capacity.
New Jersey is the clearest outlier, triggering six red flags—including deeply negative unrestricted net position, extremely low cash reserves, and weak liquidity.
Connecticut follows with four red flags and the highest per-capita debt burden.
California, Illinois, Hawaii, Massachusetts, and North Dakota each show three red flags, driven by massive long-term obligations and, in some cases, liquidity constraints.
By contrast, nearly half of all states, 23, register zero red flags.
This regional pattern largely disappears at the local level.
Many large local jurisdictions within high-performing states like Texas or Florida demonstrate multiple red flags, while many local governments in California or Washington have managed their finances prudently.
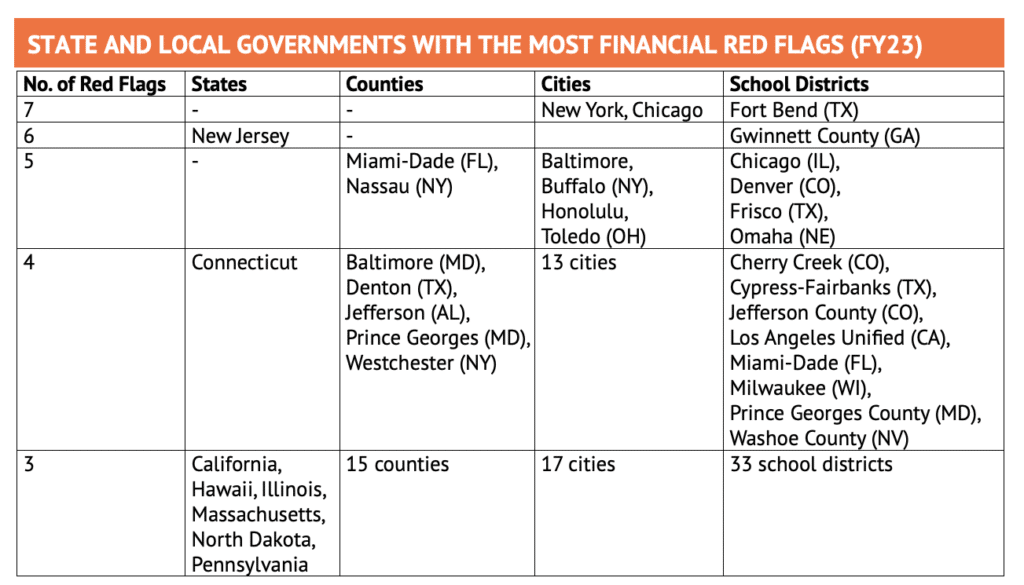
Among the nation’s 100 most populous counties, Nassau County, New York, and Miami-Dade County, Florida, each trigger five red flags. Other major counties in Alabama, Maryland, New York, and Texas show four red flags. Meanwhile, 59 of these 100 counties display fewer than two red flags.
Among America’s largest cities, fiscal performance varies dramatically, but several high-profile urban centers stand out for accumulating multiple red flags that signal deep structural challenges. The cities of Chicago and New York are among the most concerning, each triggering red flags on seven out of eight metrics—indicating severe stress across both long-term solvency and short-term liquidity.
These jurisdictions grapple with extraordinarily high debt loads, deeply negative unrestricted net positions, and precarious cash positions that limit their ability to weather economic shocks or maintain service levels without significant tax increases.
Fiscal stress is especially widespread among large school districts. Only two of the 100 largest school districts—Baltimore City Public School System and Rutherford County Schools (Tennessee)—show zero red flags. At the opposite end, Fort Bend Independent School District (Texas) triggers seven red flags.
The risks compound in places with overlapping layers of government. Chicago residents, for instance, face red flags from the state, county, city, and school district. Chicago residents face a combined debt burden of roughly $49,431 per resident when considering their shares of state, county, and city obligations combined.
Despite these alarming trends in some jurisdictions, the data also offers hope. Many large cities, counties, and states are managed with notable financial prudence, showing few or no red flags. These governments demonstrate that disciplined budgeting, realistic actuarial assumptions, and proactive reserve-building can support quality services while preserving long-term financial health.
In the end, America’s state and local fiscal landscape is one of contrasts. While some large jurisdictions are stewarded responsibly and stand on solid financial ground, many others raise serious concerns.
The objective metrics in this analysis provide a powerful tool for policymakers, taxpayers, and residents to identify risks early and demand greater accountability, spending restraint, and structural reforms to head off potential disaster. Sustainable public finance is not an accident—it is the result of deliberate, prudent choices that well-managed governments across the country continue to prove possible.
New Jersey and Connecticut are the most financially distressed states
Full policy study: State and local government finances in America: A comprehensive analysis of debt and liquidity