Welcome to Reason Foundation’s Government Financial Transparency Project.
This dashboard compiles the key elements of governmental financial statements for fiscal years 2020, 2021, and 2022, covering all 50 states and the top 100 municipalities, counties and school districts.
A historical challenge in comparing the financial health of state and local governments has been that these entities do not prepare their financial statements in a machine-readable format. In some cases, certain reporting entities also fail to adhere to governmental accounting standards generally accepted in the United States.
Reason Foundation has responded to this gap by developing a proprietary automated approach to data extraction of key elements from the financial statements, the results of which are subsequently confirmed by manual human review.
We hope to provide valuable insights for policymakers, journalists, market participants, and other stakeholders by placing their state, municipality, county, or school district in contrast to their peers – and the broader context of the country.
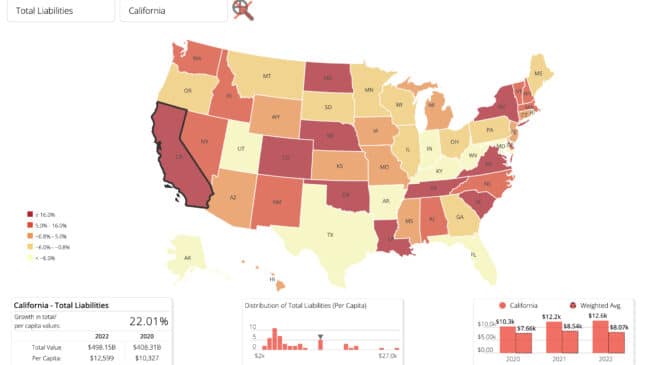
At the end of fiscal 2022, five state governments had more than $200 billion in total liabilities: California, Illinois, New York, New Jersey and Texas.
Massachusetts had over $100 billion in total liabilities, Connecticut and Washington had over $90 billion, and Pennsylvania, Florida and Maryland each had over $60 billion in total liabilities at the end of fiscal 2022.
From the 2020 fiscal year through the 2022 fiscal year, 47 states saw increased revenues. Alaska, Michigan, and Wyoming were the three states that did not increase revenues.
During the same 2020-2022 period, total assets, such as growth in cash, investments, receivables, land, buildings, and infrastructure, increased for all 50 states.
The increase in assets helped 49 states, every state except North Dakota, reduce its state debt ratio, which is defined as the proportion of total liabilities to total assets from fiscal year (FY) 2020 to FY 2022.
At the end of the 2022 fiscal year, the 50 state governments held $1.03 trillion in employee-related debt, including $502 billion in net public pension liabilities and $524 billion in net other post-employment benefit liabilities, such as promised medical benefits for retirees.
For the tool’s full interactivity and options, please visit https://debttrends.transparencyproject.reason.org.
County debt: Los Angeles, Philadelphia, Denver, Miami-Dade and Cook counties among worst in nation


