

This is an excerpt of the executive summary from the 26th Annual Highway Report.
Reason Foundation’s Annual Highway Report has tracked the performance of the 50 state-owned highway systems from 1984 to 2019. The 26th Annual Highway Report ranks the performance of state highway systems in 2019, with congestion and bridge condition data from 2020.
Each state’s overall rating is determined by rankings in 13 categories, including highway expenditures per mile, Interstate and primary road pavement conditions, urbanized area congestion, bridge conditions, and fatality rates. The study is based on spending and performance data state highway agencies submitted to the federal government and reviews changes in highway performance over the past year.
Although individual state highway sections (roads, bridges, pavements) steadily deteriorate over time due to age, traffic, and weather, they are improved by maintenance and reconstruction. As a result, system performance can improve even as individual roads and bridges deteriorate.
Table ES1 summarizes recent system trends for key indicators.
From 2018 to 2019, for example, the U.S. continued a decades-long trend of steady, incremental improvement.
All four spending measures for the U.S. state-owned highway system increased between 2018 and 2019 (states spent more money on their highway systems in 2019 than in 2018). Eight of the nine highway performance measures used in the report improved including Rural Interstate Pavement Condition, Urban Interstate Pavement Condition, Rural Arterial Pavement Condition, Urban Arterial Pavement Condition, Urbanized Area Congestion, Structurally Deficient Bridges (a smaller percentage of bridges is structurally deficient), Overall Fatality Rate, and Rural Fatality Rate. The ninth performance measure, Urban Fatality Rate, held steady between 2018 and 2019.
States are spending more money but drivers are receiving a significantly higher quality roadway system.
Each State’s Highway Performance Rankings By Year (2016-2019 Data)
| Statistic | 2016 | 2018 | 2019 | Percent Change 2016-18 | Percent Change 2018-19 |
|---|---|---|---|---|---|
| Mileage Under State Control (Thousands) | 837 | 857 | 781 | 2.39% | -8.87% |
| Total Disbursements per Lane-Mile, $ | $71,117 | $80,658 | $83,714 | 13.42% | 3.80% |
| Disbursements per Lane-Mile, Capital/Bridges, $ | $36,681 | $40,995 | $41,850 | 11.76% | 2.09% |
| Disbursements per Lane-Mile, Maintenance, $ | $11,929 | $14,111 | $14,570 | 18.29% | 3.25% |
| Disbursements per Lane-Mile, Administration, $ | $4,501 | $5,059 | $5,351 | 12.40% | 5.77% |
| Consumer Price Index (1983=$1.00) | $2.42 | $2.53 | $2.57 | 4.55% | 1.56% |
| Rural Interstate, Percent Poor Condition | 1.96 | 2.04 | 2.00 | 4.08% | -2.00% |
| Urban Interstate, Percent Poor Condition | 5.18 | 5.23 | 4.97 | 1.00% | -4.97% |
| Rural Other Principal Arterial, Percent Poor Condition | 1.36 | 1.20 | 1.15 | 11.80% | -4.35% |
| Urban Other Principal Arterial, Percent Poor Condition* | 13.97 | 14.06 | 13.52 | 0.64% | -3.84% |
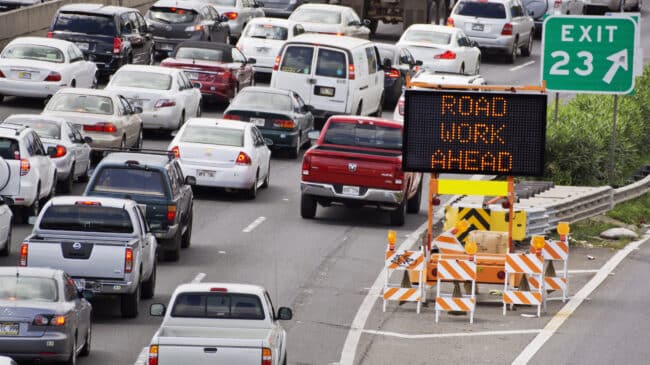
| Urbanized Area Congestion | 34.77 | 33.43 | 23.83 | -3.85% | -28.72% |
| Structurally Deficient Bridges, Poor Condition | 9.10 | 7.62 | 7.46 | -16.26% | -2.10% |
| Fatality Rate per 100 Million Vehicle-Miles All Roadways | 1.18 | 1.13 | 1.11 | -4.24% | -1.76% |
| Rural Fatality Rate per 100 Million Vehicle-Miles, All Arterials | 1.71 | 1.36 | 1.26 | -20.47% | -7.35% |
| Urban Fatality Rate per 100 Million Vehicle-Miles, All Arterials | 0.77 | 0.82 | 0.82 | -6.50% | 0% |
Table ES2 summarizes system trends over the past 10 years. Over a 10-year period disbursements increased, pavement quality worsened, congestion improved (on a statewide basis), the percentage of structurally deficient bridges decreased, and the fatality rate held steady. The worsening pavement quality and fatality rate are a change from the previous 10-year period. Figure ES2 displays this info in a graph.
Historical Trends in State Highway System Performance (2008-2018 Data)
| Statistic | 2008 | 2009 | 2010 | 2011 | 2012 | 2013 | 2014 | 2015 | 2016 | 2017 | 2018 |
|---|---|---|---|---|---|---|---|---|---|---|---|
| Mileage Under State Control (Thousands) | 816 | 814 | NA | 814 | 814 | 815 | 817 | 814 | 837 | NA | 857 |
| Total Disbursements per Lane-Mile, $ | $145,127* | $144,533* | $150,209* | $152,589* | $162,202* | $160,997* | $173,931* | $178,116* | $71,117 | NA | $94,870 |
| Disbursements per Mile, Capital/Bridges, $ | $77,130* | $79,951* | $81,515* | $81,844* | $86,153* | $84,494* | $90,969* | $91,992* | $36,681 | NA | $46,805 |
| Disbursements per Mile, Maintenance, $ | $22,937* | $25,497* | $25,652* | $25,129* | $26,079* | $25,996* | $27,559 | $28,020* | $11,929 | NA | $15,952 |
| Disbursements per Mile, Administration, $ | $13,214* | $11,356* | $10,484* | $10,430* | $10,579* | $10,051* | $9,980* | $10,864* | $4,501 | NA | $6,443 |
| Consumer Price Index (1983=1.00) | 216 | 216 | 222 | 225 | 232 | 235 | 239 | 239 | 242 | 248 | 253 |
| Rural Interstate, Percent Poor Condition | 1.93 | 1.67 | NA | 1.78 | 1.78 | 2 | 2.11 | 1.85 | 1.96 | NA | 1.89 |
| Urban Interstate, Percent Poor Condition | 5.37 | 4.97 | NA | 5.18 | 4.97 | 5.37 | 5.22 | 5.02 | 5.18 | NA | 5.1 |
| Rural Other Principal Arterial, Percent Poor Condition | 0.53 | 0.65 | NA | 0.77 | 0.89 | 1.27 | 1.2 | 1.35 | 1.36 | NA | 2.59 |
| Urban Other Principal Arterial, Percent Poor Condition | NA | NA | NA | NA | NA | NA | NA | NA | 13.97 | NA | 12.06 |
| Urbanized Area Congestion | 48.61** | 46.67** | NA | 42.15** | NA | 40.99** | 51.40** | 34.95 | NA | 34.7 | 33.43*** |
| Structurally Deficient Bridges, Poor Condition | NA | NA | NA | NA | NA | NA | NA | 9.6 | 9.1 | 8.86 | 7.94 *** |
| Fatality Rate per 100 Million Vehicle-Miles All Roadways | 1.25 | 1.14 | 1.11 | 1.1 | 1.13 | 1.1 | 1.08 | 1.13 | 1.18 | NA | 1.14 |
| Rural Fatality Rate per 100 Million Vehicle-Miles, All Arterials | NA | NA | NA | NA | NA | NA | 1.3 | 1.58 | 1.71 | NA | 1.42 |
| Urban Fatality Rate per 100 Million Vehicle-Miles, All Arterials | NA | NA | NA | NA | NA | NA | 0.67 | 0.7 | 0.77 | NA | 0.78 |
The top-performing states in the report tend to be a mix of high-population and low-population states that lean both urban and rural. Very-rural, low-population states may have a slight advantage in the overall rankings. North Dakota leads the rankings for the fourth year in a row, followed by a diverse set of states: Virginia, Missouri, Kentucky, and North Carolina. A number of states with large populations and/or large metro areas fare well in the overall rankings: Virginia (2nd), Missouri (3rd), North Carolina (5th), Tennessee (10th), Georgia (14th), and Texas (16th).
At the other end of the rankings are New Jersey, Rhode Island, Alaska, Hawaii, and New York have the worst combination of highway performance and cost-effectiveness. While very-rural, low-population states may have a slight advantage, three of the five worst-performing states rank in the bottom 10 in population.
Certain states spend significantly more than the national average. This spending may be justified if these states perform well in performance categories. Unfortunately, some of the states that spend the most money are some of the worst performers in highway conditions and maintenance.
Some states had large increases or decreases in their ratings. The rankings for Georgia, New Hampshire, Utah, Vermont, Virginia, and Wyoming improved by at least 10 spots. However, the rankings for Michigan, New Mexico, Ohio, and South Carolina all worsened by at least 10 spots.
Some of the trends in this year’s report include:
- For total disbursements, three states spend more than $250,000 per lane-mile: Massachusetts, New York, and New Jersey.
- For capital and bridge disbursements, four states spend more than $100,000 per lane-mile: New Jersey, Florida, Rhode Island, and New York.
- For maintenance disbursements, three states spend more than $50,000 per lane- mile: New Jersey, Washington, and New York.
- For administrative disbursements, two states spend more than $20,000 per lane- mile: Delaware and New Jersey.
System performance problems in each measured category seem to be concentrated in a few states:
- Approximately 25% of the rural Interstate mileage in poor condition is in just three states: Alaska, Colorado, and Washington.
- More than 11% of the urban Interstate mileage in poor condition is in just four states: Hawaii, Louisiana, Delaware, and New Jersey.
- Approximately 15% of the rural arterial mileage in poor condition is in just five states: Alaska, Rhode Island, Hawaii, New Jersey, and Maine.
- Approximately 43% of the urban arterial primary mileage in poor condition is in just six states: Rhode Island California, Nebraska, Massachusetts, New York, and New Jersey.
- Automobile commuters in four states spend more than 50 hours annually, on average, stuck in peak-hour traffic congestion: New Jersey, Delaware, Illinois, and New York.
- Although a majority of states saw the percentage of structurally deficient bridges decline, five states report more than 15% of their bridges as structurally deficient: Rhode Island, West Virginia, Iowa, South Dakota, and Pennsylvania.
- Three states have overall fatality rates of 1.5 per 100 million vehicle-miles traveled or higher: South Carolina, Mississippi, and New Mexico.
- Five states have rural fatality rates of 2.0 per 100 million vehicle-miles traveled or higher: Hawaii, Nevada, South Carolina, Arkansas, and Alaska.
- Urban fatality rates continue to worsen and 11 states have urban fatality rates of 1.0 per 100 million vehicle-miles traveled or higher: New Mexico, Arizona, Florida, Alaska, Tennessee, Hawaii, Arkansas, Alabama, South Carolina, Georgia, and Texas.
System performance improved this year, with more than half of the states (30 of 50) making progress in 2019 compared to 2018. However, a 10-year average of state overall performance data indicates that system performance problems are concentrated in the bottom 10 states. These states are finding it difficult to improve. There is also increasing evidence that higher-level road systems (Interstates, other freeways, and principal arterials) are in better shape than lower-level road systems, particularly local roads. Improved system performance is coming with increased costs. Since 2018, spending has increased by 4%.
26th Annual Highway Report Overall Performance and Cost-Effectiveness Rankings
26th Annual Highway Report: Each State’s Highway Performance Ranking By Category
| State | Overall | Total Disbursements per Mile | Capital & Bridge Disbursements per Mile | Maintenance Disbursements per Mile | Administrative Disbursements per Mile | Rural Interstate Pavement Condition | Urban Interstate Pavement Condition | Rural Arterial Pavement Condition | Urban Arterial Pavement Condition | Urbanized Area Congestion | Structurally Deficient Bridges | Overall Fatality Rate | Rural Fatality Rate | Urban Fatality Rate |
|---|---|---|---|---|---|---|---|---|---|---|---|---|---|---|
| Alabama | 28 | 23 | 29 | 11 | 40 | 24 | 38 | 26 | 5 | 20 | 9 | 36 | 40 | 43 |
| Alaska | 48 | 34 | 38 | 36 | 20 | 48 | 6 | 50 | 4 | 7 | 38 | 30 | 46 | 47 |
| Arizona | 29 | 37 | 39 | 15 | 39 | 32 | 13 | 31 | 12 | 31 | 3 | 41 | 33 | 49 |
| Arkansas | 17 | 9 | 14 | 7 | 4 | 33 | 37 | 28 | 18 | 5 | 14 | 37 | 47 | 44 |
| California | 45 | 44 | 41 | 47 | 38 | 40 | 44 | 32 | 49 | 43 | 25 | 25 | 32 | 32 |
| Colorado | 37 | 28 | 27 | 38 | 33 | 47 | 36 | 23 | 33 | 35 | 18 | 26 | 26 | 33 |
| Connecticut | 31 | 43 | 43 | 40 | 30 | 1 | 5 | 40 | 31 | 33 | 22 | 9 | 3 | 14 |
| Delaware | 44 | 40 | 32 | 45 | 50 | NA | 48 | 1 | 13 | 49 | 8 | 34 | 42 | 19 |
| Florida | 41 | 47 | 49 | 44 | 35 | 9 | 20 | 6 | 2 | 37 | 6 | 42 | 43 | 48 |
| Georgia | 14 | 20 | 19 | 25 | 34 | 23 | 16 | 3 | 1 | 34 | 7 | 28 | 22 | 41 |
| Hawaii | 47 | 41 | 45 | 39 | 28 | NA | 50 | 48 | 44 | 18 | 26 | 17 | 50 | 45 |
| Idaho | 8 | 21 | 25 | 16 | 14 | 1 | 3 | 7 | 17 | 16 | 23 | 32 | 36 | 29 |
| Illinois | 40 | 39 | 40 | 35 | 22 | 27 | 41 | 42 | 30 | 48 | 37 | 13 | 15 | 25 |
| Indiana | 32 | 33 | 36 | 42 | 19 | 44 | 40 | 15 | 21 | 38 | 21 | 16 | 27 | 17 |
| Iowa | 22 | 19 | 34 | 18 | 16 | 18 | 30 | 34 | 29 | 22 | 48 | 18 | 13 | 13 |
| Kansas | 7 | 18 | 6 | 14 | 17 | 17 | 29 | 5 | 20 | 25 | 16 | 35 | 45 | 22 |
| Kentucky | 4 | 12 | 7 | 13 | 1 | 21 | 23 | 9 | 6 | 23 | 29 | 47 | 20 | 39 |
| Louisiana | 35 | 15 | 12 | 22 | 7 | 43 | 49 | 44 | 38 | 39 | 45 | 43 | 25 | 38 |
| Maine | 33 | 17 | 16 | 29 | 6 | 37 | 4 | 46 | 32 | 30 | 44 | 23 | 12 | 5 |
| Maryland | 38 | 45 | 46 | 41 | 29 | 25 | 42 | 20 | 39 | 42 | 15 | 12 | 5 | 23 |
| Massachusetts | 43 | 48 | 42 | 43 | 48 | 41 | 19 | 21 | 47 | 44 | 36 | 1 | 4 | 8 |
| Michigan | 34 | 32 | 35 | 28 | 23 | 42 | 45 | 17 | 42 | 46 | 43 | 14 | 7 | 26 |
| Minnesota | 18 | 27 | 23 | 32 | 25 | 35 | 35 | 25 | 7 | 28 | 13 | 2 | 6 | 2 |
| Mississippi | 15 | 13 | 15 | 4 | 10 | 26 | 26 | 22 | 28 | 13 | 33 | 49 | 35 | 36 |
| Missouri | 3 | 5 | 1 | 9 | 13 | 11 | 18 | 12 | 24 | 9 | 34 | 27 | 18 | 37 |
| Montana | 11 | 6 | 8 | 6 | 9 | 20 | 14 | 35 | 37 | 4 | 27 | 44 | 37 | 4 |
| Nebraska | 21 | 11 | 10 | 19 | 2 | 29 | 21 | 37 | 48 | 2 | 35 | 31 | 39 | 31 |
| Nevada | 20 | 31 | 34 | 23 | 46 | 13 | 11 | 2 | 9 | 21 | 1 | 24 | 49 | 30 |
| New Hampshire | 19 | 22 | 20 | 26 | 44 | 1 | 2 | 39 | 23 | 24 | 32 | 5 | 29 | 3 |
| New Jersey | 50 | 50 | 50 | 50 | 49 | 1 | 47 | 47 | 45 | 50 | 30 | 4 | 9 | 18 |
| New Mexico | 27 | 7 | 5 | 1 | 36 | 30 | 24 | 27 | 35 | 6 | 20 | 48 | 41 | 50 |
| New York | 46 | 49 | 47 | 48 | 41 | 39 | 46 | 38 | 46 | 47 | 40 | 6 | 17 | 10 |
| North Carolina | 5 | 14 | 17 | 12 | 11 | 22 | 10 | 8 | 10 | 29 | 39 | 29 | 24 | 21 |
| North Dakota | 1 | 2 | 11 | 2 | 5 | 7 | 2 | 19 | 26 | 17 | 42 | 20 | 8 | 12 |
| Ohio | 24 | 26 | 22 | 17 | 42 | 28 | 32 | 16 | 40 | 11 | 19 | 19 | 11 | 16 |
| Oklahoma | 36 | 30 | 26 | 37 | 31 | 38 | 39 | 43 | 27 | 32 | 41 | 45 | 31 | 34 |
| Oregon | 25 | 38 | 29 | 30 | 32 | 12 | 22 | 14 | 19 | 36 | 17 | 39 | 34 | 35 |
| Pennsylvania | 39 | 35 | 24 | 34 | 37 | 36 | 43 | 33 | 34 | 45 | 46 | 22 | 10 | 27 |
| Rhode Island | 49 | 46 | 48 | 46 | 43 | 1 | 12 | 49 | 50 | 41 | 50 | 7 | 1 | 24 |
| South Carolina | 23 | 3 | 9 | 3 | 8 | 45 | 28 | 24 | 11 | 26 | 31 | 50 | 48 | 42 |
| South Dakota | 9 | 4 | 4 | 8 | 27 | 10 | 15 | 29 | 16 | 12 | 47 | 21 | 14 | 6 |
| Tennessee | 10 | 16 | 18 | 20 | 26 | 16 | 9 | 10 | 8 | 19 | 11 | 40 | 23 | 46 |
| Texas | 16 | 24 | 30 | 23 | 12 | 14 | 25 | 13 | 36 | 40 | 2 | 33 | 28 | 40 |
| Utah | 6 | 36 | 37 | 31 | 21 | 5 | 8 | 11 | 3 | 1 | 4 | 8 | 38 | 15 |
| Vermont | 13 | 25 | 21 | 33 | 45 | 7 | 7 | 36 | 14 | 14 | 5 | 3 | 2 | 1 |
| Virginia | 2 | 8 | 2 | 27 | 18 | 6 | 17 | 4 | 15 | 27 | 10 | 15 | 19 | 9 |
| Washington | 42 | 42 | 44 | 49 | 47 | 46 | 27 | 30 | 43 | 10 | 12 | 10 | 21 | 7 |
| West Virginia | 30 | 1 | 3 | 5 | 3 | 31 | 33 | 45 | 25 | 8 | 49 | 38 | 30 | 28 |
| Wisconsin | 26 | 29 | 28 | 24 | 24 | 34 | 31 | 41 | 41 | 15 | 28 | 11 | 16 | 11 |
| Wyoming | 12 | 10 | 13 | 10 | 15 | 19 | 34 | 18 | 22 | 3 | 24 | 46 | 44 | 20 |
*State-controlled miles were used from 2008 to 2015. From 2016 to 2019 state-controlled lane-miles were used.
**A different congestion metric was used for these years.
***Data from 2019
****Data from 2020
NOTE: Due to a significant lag in FHWA publishing data from the states that is used in this report, the Annual Highway Report that would’ve had 2017 was not published and thus 2017 data is not included.