


Reason Foundation’s 2025 Pension Solvency and Performance Report ranks every state’s pension system across five dimensions—funded status, investment performance, contribution adequacy, asset allocation risk, and the probability of meeting assumed returns—based on the latest fiscal year data from nearly every major plan in the country.
The sections from the 2025 Pension Solvency and Performance Report and dashboard below summarize the strongest and weakest performers in each category. For each state, the results reflect the aggregate values of its major pension systems, including plans administered at both the state and local levels.
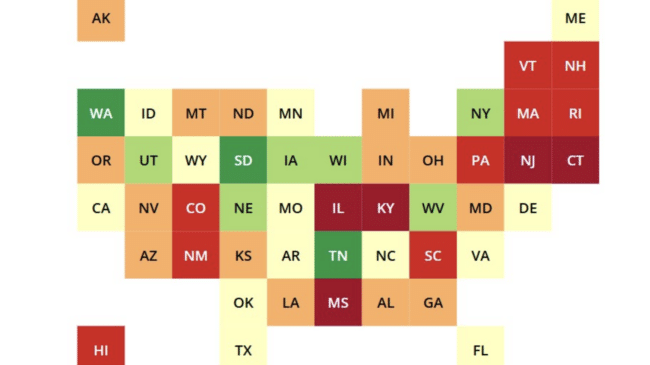
Funded ratio state ranking
The funded ratio is the most straightforward indicator of a pension system’s financial health. It states what share of liabilities can be funded with currently owned assets. States with higher ratios are better positioned to weather downturns, while those with persistent gaps carry a greater risk of future tax increases or benefit cuts.
Only three states had enough or more assets set aside to cover promised benefits. Tennessee (104%) ranked first nationally, followed closely by Washington (103%) and South Dakota (100%).
Conversely, Illinois (52%), Kentucky (54%), and New Jersey (55%) posted the weakest funded ratios.
Among the five most populous states, New York ranks 6th (94%), Florida ranks 19th (82%), California ranks 20th (82%), Texas ranks 22nd (80%), and Pennsylvania ranks 41st (66%).
Investment performance state ranking
The investment performance ranking evaluates how pension plans’ long-term returns compare to their assumed rates of return. When plans fall short of expectations, unfunded liabilities accumulate and must eventually be addressed through higher contributions, typically from taxpayers.
Only four states have long-term returns exceeding assumptions. Kansas (+1.5%) leads this category, with long-term returns exceeding its assumptions by 1.5 percentage points. Michigan (+0.7%), Washington (+0.6%), and South Dakota (+0.4%) follow.
Maryland (-1.5%), Alaska (-1.4%), and New Mexico (-1.3%) posted the weakest investment performance relative to their own expectations.
Among the largest states, New York ranks fifth (-0.04%), Pennsylvania ranks seventh (-0.06%), Florida ranks 14th (-0.3%), Texas ranks 19th (-0.4%), and California ranks 35th (-0.7%).
Employer contribution adequacy state ranking
Contribution adequacy measures the extent to which states are providing sufficient funding each year to cover both the cost of new benefits and the amortization of existing debt. Underpaying contributions creates more pension debt, which compounds over time.
Thirty-nine states meet or exceed our contribution rate adequacy measure, which is based on actuarially determined benchmarks.
Louisiana ranks first in this category, contributing 13.4% more than the actuarial benchmarks. West Virginia (+12.3%), Maine (+10.4%), Connecticut (+10.1%), and Michigan (+9.7%) also posted contributions above actuarial requirements. Many states are dedicating supplemental funding to accelerate the elimination of pension debt, thereby significantly reducing long-term interest costs.
Mississippi (-8.3%), Oregon (-3.7%), and Illinois (-3.5%) posted the weakest contribution adequacy. Their negative measurements indicate they are contributing below the mark set by actuaries to avoid adding more unfunded liabilities.
Among the largest states, California ranks 10th (+7.1%), New York ranks 24th (+2.5%), Florida ranks 32nd (+1.2%), Texas ranks 38th (+0.2%), and Pennsylvania ranks 36th (+0.5%).
Alternative asset allocation state ranking
The alternative asset allocation ranking evaluates states based on the share of their portfolios invested in alternative assets. This category includes assets such as private equity, hedge funds, real estate, and private credit. Larger allocations to alternative assets indicate riskier and more opaque investment strategies.
Georgia (1%) and Alabama (9%) report the lowest allocations to alternatives, placing them at the top of the rankings. Oklahoma (11%), Nevada (12%), and Nebraska (14%) also maintain more conservative portfolios.
Seven states have at least half of their assets allocated to alternative assets, placing them among the riskiest systems in the country. Hawaii (60%) leads, followed by Maine (58%), Oregon (58%), and Washington (55%).
Among the largest states, New York ranks 15th (27%), Florida ranks 22nd (30%), California ranks 32nd (37%), Pennsylvania ranks 28th (35%), and Texas ranks 42nd (49%).
Assumed return rate probability state ranking
The assumed return rate probability ranking assesses whether states’ return assumptions are realistic, using forward-looking models to estimate the likelihood of success over a 20-year period.
Michigan (68%) ranks first, with the highest probability of hitting its target returns. Idaho (63%), Maine (63%), Virginia (63%), and Maryland (63%) also rank near the top.
Nevada (43%), Alabama (44%), and Louisiana (44%) posted the lowest probabilities of hitting assumed returns.
Among the largest states, New York ranks 9th (61%), Florida ranks 17th (58%), Texas ranks 23rd (56%), California ranks 25th (55%), and Pennsylvania ranks 27th (55%).
Conclusion
These rankings show an uneven fiscal condition of state pension systems. Funding ratios vary widely: a few states, such as Tennessee, Washington, and South Dakota, are fully funded, while others, such as Illinois, Kentucky, and New Jersey, have funds to cover only half of promised pension benefits.
When pension contributions are found to be inadequate retroactively, underfunding—pension debt—emerges. This gap arises because past contributions and investment returns proved insufficient to meet the cost of benefits already earned. Reckoning with this debt requires governments to allocate a greater share of their budgets to amortization payments, often diverting funds from education, infrastructure, and other essential public services. Over time, these legacy costs can compound, limiting fiscal flexibility and placing growing pressure on taxpayers.
But even among states that appear stable on funding measures, vulnerabilities persist across other dimensions, such as investment performance, contribution adequacy, and asset allocation risk.
Sustained fiscal discipline, realistic assumptions, and transparent reporting remain essential to securing the retirement benefits promised to public workers and protecting taxpayers from escalating pension debt. States that consistently make full actuarially determined contributions, align return assumptions with long-term market expectations, and manage portfolio risk prudently are best positioned to maintain solvent and resilient pension systems.
To read more about our national findings, click here.