Reason Foundation finds three of America’s 10 most populous cities held more liabilities than assets at the end of fiscal year 2022. One of these three cities, Chicago, also spent more in fiscal year 2022 than it took in as revenue, leading to a worsening balance sheet.
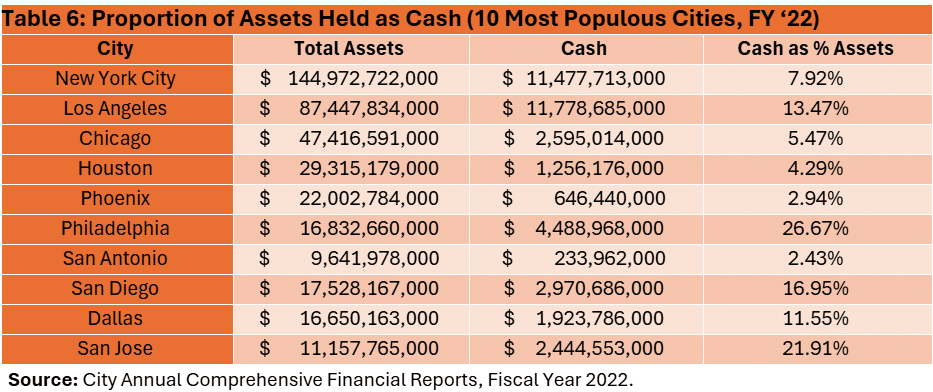
Other cities held less than 3% of their assets as cash, meaning they had limited liquidity. Liquidity measures are important because they indicate whether an entity can pay its bills as they fall due. Employees, vendors, and debt holders must all be paid in cash, so cities must either convert other assets into cash on a timely basis or generate new cash through taxes or other forms of revenue.
This analysis reviews the performance of America’s 10 most populous cities across a range of standard financial metrics related to debt and liquidity.
Debt ratio
An entity’s debt ratio is calculated by dividing its total liabilities by total assets. It reveals roughly what proportion of the entity’s assets are debt-financed versus owned outright. As with a business or household, a heavily indebted city must devote a larger share of its future cash flow toward debt service and has less financial flexibility with which to consider new priorities.

At the close of fiscal year 2022, New York City, Chicago, and Philadelphia all held more debt than the sum value of their assets. New York City had more than twice as much debt as assets. Even if these cities were able to liquidate all their storm drains, asphalt, and other capital assets at the prices they paid for those goods, they still would not be able to pay off all their debts.
The cities among this group with the lowest debt ratios (and, thus, the greatest degree of financial flexibility) were San Diego, Los Angeles, and San Jose.
Unrestricted net position
Another important measure of a city’s long-term solvency is its unrestricted net position. This is the amount by which the city’s assets exceed its outstanding debt plus the amounts it is required to set aside for specific purposes, like future debt service, maintenance of infrastructure, or other purposes established through bond covenants or local law. Unrestricted net position is essentially the amount of “cushion” a city has after meeting all its obligations.
Among the 10 most populous cities in America, only Los Angeles held a positive unrestricted net position at the close of fiscal year 2022. Some cities held deep deficits in unrestricted net position, headlined by New York City at $186.3 billion.

Revenues less expenditures
During fiscal year 2022, nine of America’s 10 most populous cities generated enough revenue to finance their expenditures. City revenues include money received in taxes, fines, fees, and grants from federal, state, or private sources. An entity’s overall financial position will deteriorate over a year if expenditures exceed revenues but may improve if revenues exceed expenditures.
Only in Chicago did expenditures exceed revenues, to the tune of $510 million.
In New York City, revenues exceeded expenditures by $10.1 billion, or $1,150 per resident. On a per-resident basis, the top-performing cities among this group were New York City, Houston, and Los Angeles, while the worst-performing cities were San Diego, San Jose, and Chicago.

Quick ratio
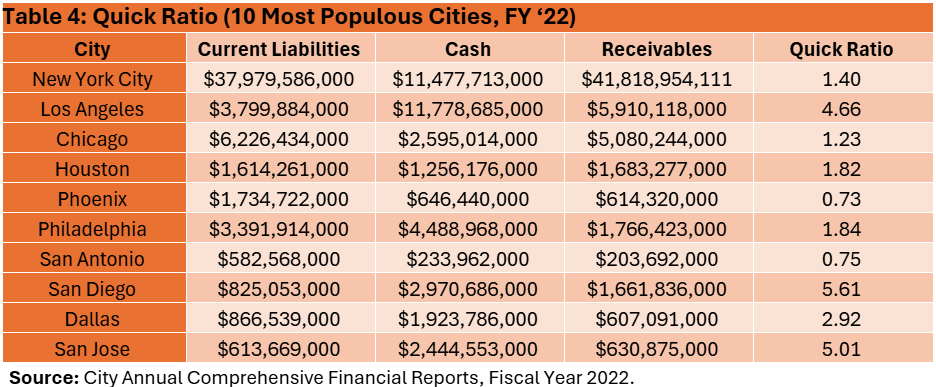
Not all assets are financial. For example, the value of physical assets like buildings or roadways are held on a city’s balance sheet, but cannot be used to settle debts as they fall due. To pay its bills, a city must have sufficient financial assets available. A common way of measuring a city’s ability to pay debts coming due is to compare its financial assets to the total of its current liabilities at the date of the balance sheet. The so-called “quick ratio” divides all assets that are either cash or expected to be quickly converted into cash (including short-term assets and receivables) by debts that must be paid within one year, including debt servicing costs, vendor payments, employee payroll, utilities, and other short-term expenses.
A value of 1 or more indicates that the entity holds sufficient financial assets to pay its bills timely, although most financial analysts prefer that an entity hold a quick ratio well above 1.
At the close of fiscal year 2022, two of America’s 10 most populous cities held a quick ratio of less than 1—Phoenix and San Antonio. Chicago and New York City held quick ratios slightly greater than 1—indicating short-term liquidity, even though these cities suffer from long-term indebtedness exceeding assets. A city can improve short-term liquidity measures like a quick ratio by issuing new long-term debt, even though this action may cause its overall balance sheet to deteriorate.
The cities in this group with the highest quick ratio include San Diego, San Jose, and Los Angeles.

Quality of receivables
While a quick ratio is an important indicator of short-term liquidity, it includes within the denominator receivables that may not be turned into cash on a timely basis. A city’s external auditors are responsible for evaluating its outstanding receivables to make a judgment on the quality of those receivables, but external auditors must also rely on the representations of city management. Management may be reluctant to recognize and expense tax assessments or other revenue sources that are uncollectible for a variety of reasons, including the resulting deterioration that action would have on the city’s financial statements.
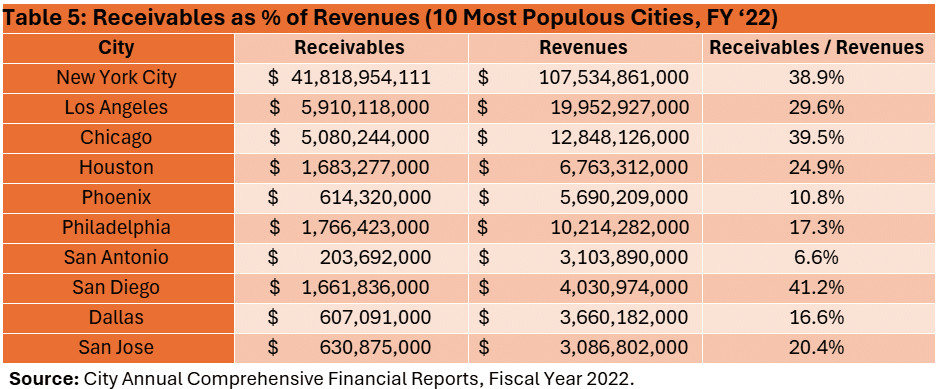
Accounting practices generally accepted in the United States require cities to disclose summary information about their receivables in the footnotes of the financial statements. However, financial analysts can glean insight into the quality of receivables by examining a city’s receivables as a share of annual revenues.
If receivables amount to a high share of revenue, this indicates the city may be having a difficult time collecting amounts owed. At the close of fiscal year 2022, receivables approached or exceeded 40% of annual revenues in New York City, Chicago, and San Diego. In other words, nearly five months’ worth of revenues has not been collected in these cities, creating potential complications for the cities’ cash flow. By contrast, receivables amounted to only 6.6% of annual revenues in San Antonio and 10.8% in Phoenix.

Cash assets
A final important method of examining a city’s short-term liquidity is by examining the proportion of its assets held as cash or cash equivalents (including short-term investments that will become cash within 90 days of the date of the balance sheet).
By this measure, the most liquid of the 10 most populous cities are Philadelphia, San Jose, and San Diego. San Antonio and Phoenix hold very low shares of their total assets as cash—reinforcing their lack of liquidity as measured by quick ratio.

Overview of Government Financial Transparency Project: State and local debt trends 2020-2020
County debt: Los Angeles, Philadelphia, Denver, Miami-Dade and Cook counties among worst in nation

