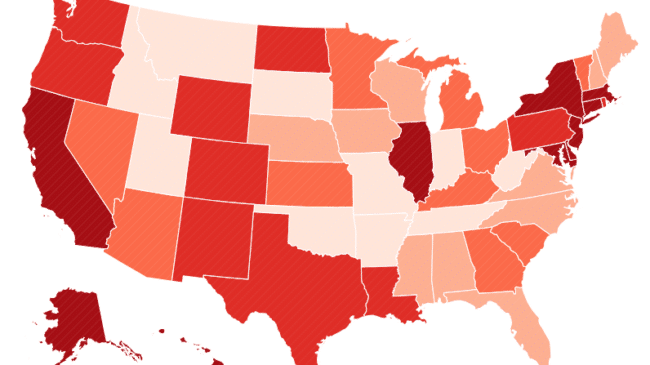



The nation’s state and local governments reported $6 trillion in total debt and nearly $5 trillion in long-term debt at the end of fiscal year 2024, the most recent year with complete data available, Reason Foundation’s State and Local Government Finance Report finds.
In per capita terms, New York ($37,006 per capita), New Jersey ($35,100), Connecticut ($33,189), Illinois ($31,582) and Hawaii ($30,759) have the highest total state and local debt, which includes debt at the state, county, city and school district levels within each state.
Massachusetts ($28,746 per capita), Alaska ($26,861), California ($26,760), Maryland ($21,028), and Delaware ($20,711) all also have more than $20,000 in state and local debt, followed closely by North Dakota ($19,890), Texas ($19,450) and Washington ($19,407).
The states with the lowest per-capita total debt are Idaho ($6,228), Indiana ($6,377), South Dakota ($6,909), Tennessee ($7,710), and West Virginia ($8,026).
These rankings combine debt reported by state governments, cities, counties, and school districts within each state. In-depth analysis of every state and local entity is available in the tool below and at https://govfinance.reason.org/.
California, New York, and Texas have the most total state and local debt
Total debt includes all liabilities reported on state and local governments’ balance sheets, including short-term obligations due within one year (such as accounts payable and accrued salaries) and long-term commitments (such as bonds, loans, unfunded pension liabilities, and retiree health care benefits).
In fiscal year 2024, state and local governments (cities, counties and school districts) reported approximately $6.1 trillion in total debt or about $18,300 per resident.
Overall, California has the most total debt in the nation: $1.06 trillion in state and local debt.
New York ($745 billion), Texas ($569 billion), Illinois ($404 billion), and New Jersey ($325 billion) rank second through fifth in total state and local debt, followed by Florida ($249 billion) and Massachusetts ($200 billion).
South Dakota and Vermont are the only two states with less than $10 billion in total state and local debt.
New Jersey, Connecticut and New York have the most per capita long-term debt
The $5 trillion of long-term debt of state and local government consists of bonds, loans, and notes (42%), unfunded pension liabilities (32%), unfunded retiree health care (19%), accrued leave payouts/compensated absences (2%), and other (5%). Long-term debt is a calculated measure that includes subcomponent obligations generally due in more than a year.
The states with the highest per-capita long-term debt across their state and local governments are New Jersey ($32,794), Connecticut ($29,840), New York ($29,430), Illinois ($27,688), and Hawaii ($26,336).
Massachusetts, California, Maryland, Delaware, Texas, Alaska, and Washington state also have per-capita long-term debt exceeding $15,000.
The states with the lowest per-capita long-term debt are Idaho ($4,053), Indiana ($4,187), South Dakota ($4,548), Tennessee ($5,186), and Oklahoma ($5,563).
Overall, California has the most long-term debt in the nation: $825 billion at the state and local levels.
New York ($592 billion), Texas ($487 billion), Illinois ($354 billion), and New Jersey ($304 billion) rank second through fifth in long-term debt.
Hawaii and Connecticut are the states with the most per capita state and local bonded debt
Bonds, loans, and notes are the largest source of long-term debt for state and local governments. Nationally, state and local governments report approximately $2.1 trillion in outstanding bonds, loans, and notes, representing 42% of their long-term liabilities, or about $6,300 per resident.
Hawaii has $14,060 in per-capita bonded debt, the highest in the nation, followed by Connecticut ($11,309), Massachusetts ($10,660), Texas ($10,634), and New York ($10,095).
The states with the lowest per-capita bonded debt are Wyoming ($557), Alabama ($1,898), Idaho ($2,082), Montana ($2,227), and Indiana ($2,449).
Overall, California has the most state and local bonded debt in the nation, at $337 billion, followed closely by Texas ($311 billion).
New York ($203 billion), Illinois ($99 billion), and Florida ($84 billion) have the next-highest amounts of total state and local bonded debt.
Illinois has the most per capita state and local pension debt
Unfunded pension liabilities (net pension liability) are the second-largest source of state and local government long-term debt, representing 31.5% of their long-term liabilities. Unfunded pension liabilities arise when governments set aside fewer assets than needed to fulfill the retirement benefits promised to their public employees.
In fiscal year 2024, state and local governments reported approximately $1.55 trillion in net pension liability, or about $4,700 per resident.
Illinois has the highest per-capita state and local public pension debt in the nation, at $17,325, followed by Connecticut ($12,229), New Jersey ($10,584), Alaska ($8,970), and Massachusetts ($8,289).
South Dakota reports no net pension liability. Tennessee ($569), Washington ($666), Wisconsin ($719), and Utah ($849) have the next-lowest per-capita pension liabilities.
Although lower than other states on a per-capita basis, California’s $282 billion in unfunded pension liabilities across all levels of government is the largest total state and local pension debt in the country.
Illinois ($222 billion), Texas ($106 billion), New Jersey ($98 billion), and Pennsylvania ($68 billion) have the next-highest amounts of state and local pension debt.
New York and New Jersey are the states with the most state and local OPEB debt
Other post-employment benefits (OPEB) consist mostly of health care promised to retired public employees. Unlike pension benefits, governments rarely prefund these promises. They typically pay for retiree health care from each year’s budget rather than setting money aside in advance. The gap between the health care benefits promised and what has been saved is reported as the net OPEB liability.
In fiscal year 2024, state and local governments reported approximately $927 billion in unfunded OPEB, or about $2,800 per resident—19% of their long-term liabilities.
New York ($13,611 per capita) and New Jersey ($11,029) have the highest per-capita state and local OPEB debt in the nation.
Delaware ($8,145 per capita in state and local OPEB debt), Connecticut ($6,484), and Massachusetts ($6,185) round out the top five.
Utah ($72), Idaho ($99), North Dakota ($100), South Dakota ($113), and Kansas ($165) have the lowest per-capita state and local OPEB debt.
With $274 billion in OPEB debt, New York has the most OPEB debt in the nation. California ($150 billion), New Jersey ($102 billion), Texas ($75 billion), and Massachusetts ($43 billion) have the next-highest amounts.
For more detailed analysis of each state and local government, please visit Reason Foundation’s Government Financial Transparency Project and GovFinance Dashboard.
If you have any questions or would like full access to the data, please email Mariana.Trujillo@reason.org and Jordan.Campbell@reason.org.