


North Carolina’s Teachers’ and State Employees’ Retirement System (TSERS) is widely recognized as being among the nation’s healthiest pension plan systems, currently almost 90 percent funded at a time when the average public pension plan has only three-quarters of the assets on hand today that will be needed to support future retirement promises. Despite applying a number of best practices for running a financially solvent pension system, the system’s funded ratio has nonetheless been dropping over the last 20 years. A system that was overfunded at the turn of the century today has $9.64 billion in unfunded pension liabilities, or pension debt.
This policy report will review some of the primary causes of TSERS’ declining fiscal solvency and evaluate a range of possible fixes that could put the system back on track to full funding.
Overall, our risk analysis reveals several potential vulnerabilities in the current TSERS plan assumptions, as well as in its investment portfolio. Our analysis has shown the plan is unlikely to reach its assumed long-term average investment return of 7.0 percent, which could lead to increases in employer contributions in the near future. Even if the plan meets the target assumed rate of return (ARR) on average, the timing of returns could negatively affect the plan’s fiscal outlook.
Although our analysis demonstrates the plan is unlikely to undergo any drastic fluctuations in contribution rates, it is evident that its funded status could potentially drop — and unfunded liabilities rise — due to the use of a range of assumptions and funding policy decisions, the most significant being an overly optimistic assumed rate of return. We also find that the plan’s portfolio includes high-risk assets prone to volatility, making investment returns less predictable.
North Carolina TSERS is a strong state retirement system that provides a valuable service to its members while using a benefit design and operating policies that have, thus far, largely shielded taxpayers from the kinds of risks that have helped drive up pension costs in states across the nation. Still, marginal improvements to the existing TSERS benefit system can pay off greatly in the future and ensure the system stays on solid financial footing for the long term. Better risk management and more realistic plan assumptions can help ensure the state delivers the promised retirement benefits to its employees.
Introduction
North Carolina’s largest public pension system — the Teachers’ and State Employees’ Retirement System (TSERS) — is one of the top 10 public pension plans in the nation in terms of funded status, currently holding 87.4 percent of the assets it needs to have on hand to ensure all accrued pension benefits are paid out over the long term, placing it well ahead of other state-run pension systems that average just over 70 percent funded.
However, for a system that was overfunded at a 111.6 percent funded ratio less than 20 years ago, the current position represents a 24-percentage-point drop from the system’s peak. Further, TSERS’ unfunded liabilities have been growing steadily since 2008, reaching $9.64 billion in 2017. Both of these indicators suggest a pension system that, while still relatively healthy, has experienced solvency challenges worth additional exploration to identify potential risks for further deterioration.
Key strengths of North Carolina’s TSERS include:
- A funded ratio of 87.4 percent, well above the national average of 72.6 percent
- The system is better positioned to close its underfunding gap than many of its peer group, and its high funded ratio is also a net positive with regard to maintaining the state’s credit rating.
- The use of a 7.0 percent assumed rate of return, well below the national average of 7.5 percent
- This ensures a more realistic evaluation of unfunded liabilities and more accurate calculation of actuarially determined pension contributions.
- A solid track record of making the full actuarially determined contributions
- Over the past 20 years, state government and local school districts met or exceeded the actuarially required contributions to TSERS every year except 2001 and 2011. Consistently making required pension contributions allows the system to stay on track to full funding.
- The use of short amortization schedules of 12 years to pay down new unfunded liabilities
- Shorter amortization periods ensure that unfunded pension liabilities are paid down in a timely manner and that pension debt does not extend past the average tenure of public employees in the system.
- The consistent use of updated mortality tables
- This keeps plan assumptions on track and enables accurate calculations of employer contributions, a critical factor for long-term solvency.
- Ad hoc cost-of-living-adjustment (COLA) increases based on plan performance, at the discretion of the General Assembly
- This ensures retirees are receiving competitive benefits, without compromising the system’s financial health.
TSERS has recently undertaken a series of changes to improve the plan’s fiscal outlook, including lowering the assumed rate of return (ARR) and discount rate, as well as the introduction of Session Law 2014-88 (House Bill 1195 of 2014), the Fiscal Integrity/Pension-Spiking Prevention Act, a law limiting the “spikes” of highly compensated employees’ final average salaries as a way to increase retirement benefits. While these prudent changes are likely to improve the situation, our analysis suggests that additional changes can improve the retirement security of North Carolina’s state employees and do so in advance of the next economic downturn, after which changes will inevitably become more costly and difficult.
This policy report provides a risk assessment of the current TSERS system and projects any changes in employer contributions, as well as funded ratio fluctuations, that might arise from investment underperformance. It also provides several recommendations of incremental improvements to the plan that could help secure future benefits for its members for the long term.
TSERS at a Glance
History
The North Carolina’s Teachers’ and State Employees’ Retirement System (TSERS) is a defined benefit (DB) pension plan established on July 1, 1941 and administered by the State Treasurer. TSERS is governed by a 13-member board of trustees, including the Treasurer, Superintendent of Public Instruction, eight gubernatorial appointees, and two members appointed by the General Assembly.
Membership
Eligible employees are permanent full-time teachers, the staff of state-supported educational institutions, and state employees working at least 30 hours per week for nine months per year. According to the December 2017 valuation (the most recent available), the plan has 304,554 active members, 6,680 members on disability, 160,087 terminated members or survivors of deceased members entitled to, but not currently receiving benefits, and 215,008 retired members or survivors collecting benefits.
Benefit Structure
The TSERS pension is deferred compensation representing promises made to the employee regarding guaranteed lifetime income benefits, defined by a statutory formula, to be provided once that employee retires. Workers become vested in TSERS after five years of membership and become eligible for full retirement benefits after either: (1) reaching age 65 and completing five years of membership service, (2) reaching age 60 and completing 25 years of creditable service, or (3) completing 30 years of creditable service at any age. Once retirement eligibility requirements are met, the annual benefit for TSERS beneficiaries is calculated as follows:
Annual TSERS benefit = 1.82% x average final compensation x years of creditable service
Average final compensation is the average salary during a worker’s four highest-paid consecutive years. Creditable service includes the years and months of membership service that an employee has contributed to TSERS. Creditable service may include benefits such as sick leave credit, military service credit, and purchased service credit.
TSERS, like most DB pension plans, is funded by setting aside a percentage of a worker’s salary (known as the employee contribution rate) into an investment fund, along with a contribution made by the employer on that employee’s behalf. The total contribution rate is actuarially calculated and divided among both the employer and employee. The income from contributions are pooled into a fund that is then invested to achieve a targeted return. This mix of contributions and investment earnings is used to pay out future pension benefits.
1. Overview of North Carolina TSERS
TSERS Declining Solvency, Rising Pension Debt
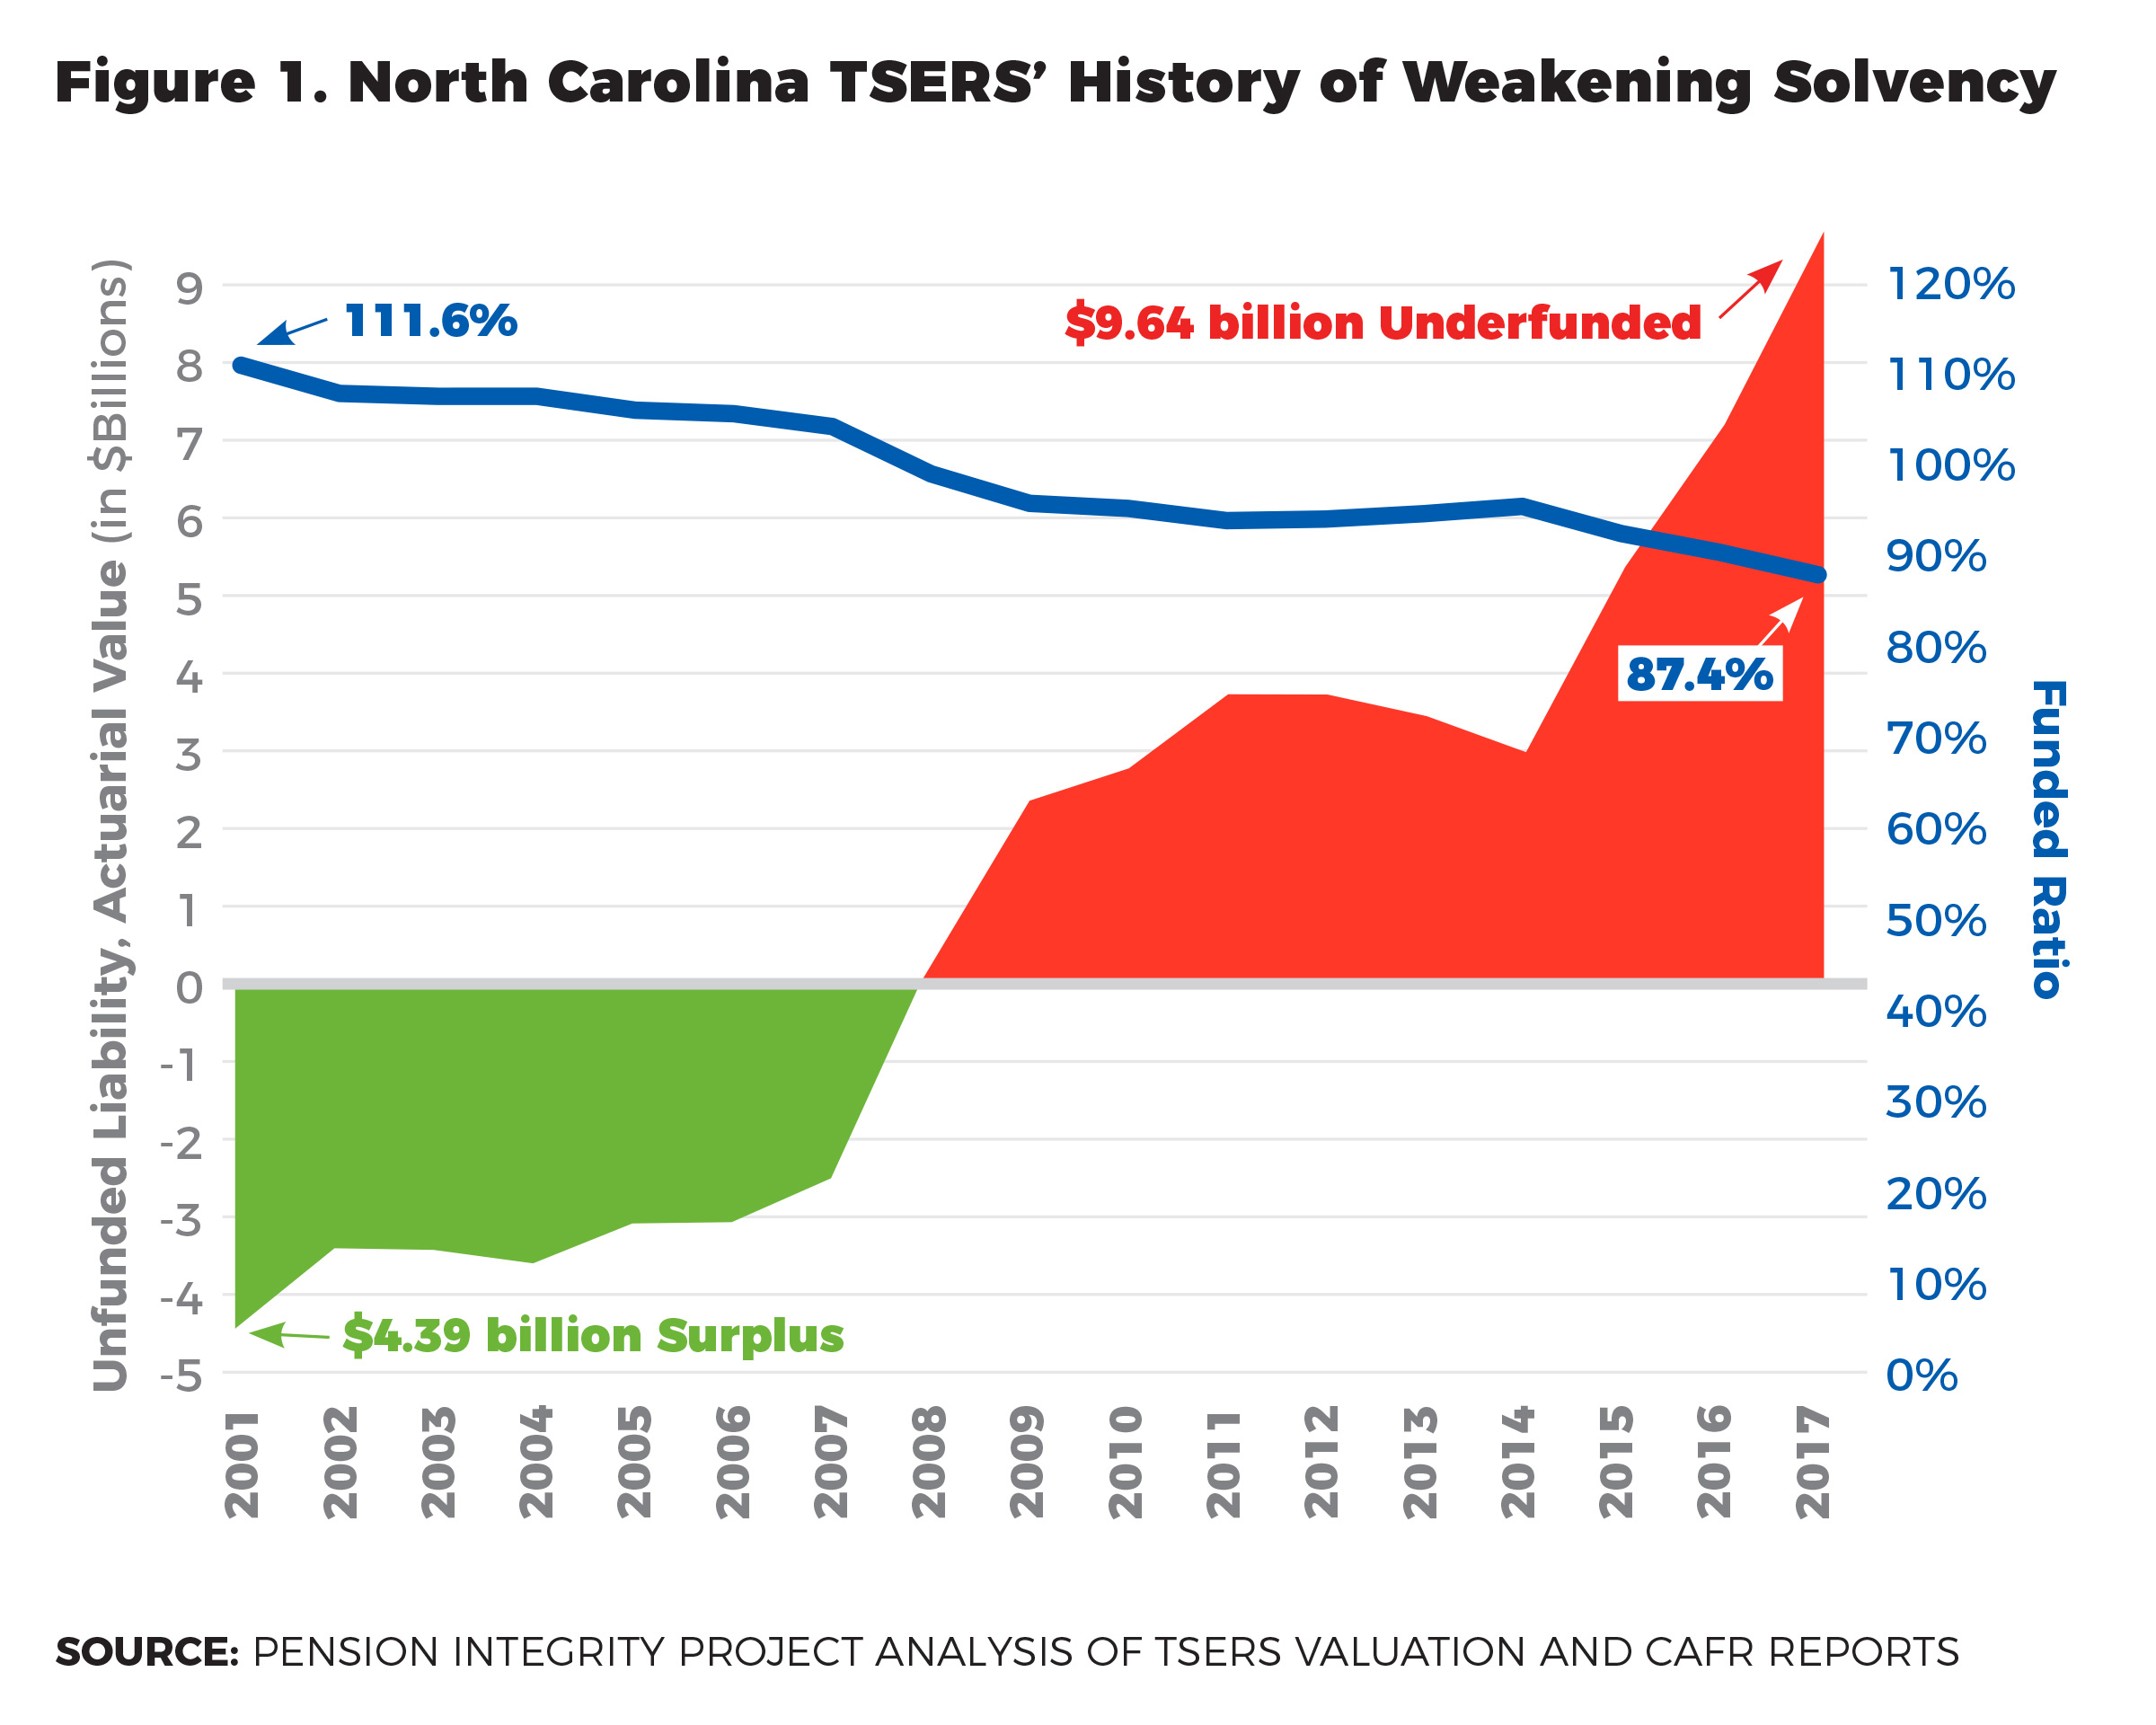
TSERS currently has on hand assets projected to meet 87.4 percent of its pension liabilities, or promised benefits. While TSERS stands in an enviable funding position relative to other states — only Wisconsin, South Dakota and a few other public pension plans can boast higher funding levels today — Figure 1 shows that TSERS’ funded ratio has actually been declining since 2000, not holding steady or improving.
In early 2001, the plan boasted a massive surplus of $4.39 billion as the actuarial value of assets ($42.1 billion) surpassed the actuarily accrued liability ($37.7 billion), yielding a 111.6 percent funded ratio. However, like most of the nation’s pension plans, TSERS was not immune to the economic downturn caused by the financial crisis of 2008. From 2007 to 2016, TSERS’ trajectory worsened, shifting from surplus to debt as increasing unfunded pension liabilities mounted with economic underperformance and other factors. Today, the plan has over $9.64 billion in unfunded accrued actuarial liabilities. This represents a net $14 billion decline over that period.
Although the funded ratio metric puts North Carolina’s TSERS among the top 10 best-funded pensions in the country in terms of funded ratio, its continued decline calls for a closer examination of the factors driving the system’s current financial health.

TSERS’ unfunded liability emerged during the financial crisis of 2008 and has been growing since. It was relatively flat from 2010 to 2014, but has been growing despite a booming stock market that could have reversed reverse the decline. As shown in Figure 2, the fiscal health of TSERS is no longer in step with the general performance of the market.

Using data from the Federal Reserve Bank of St. Louis, since 2008, state Gross Domestic Product (GDP) has grown by about 30 percent, while the unfunded liability has grown almost 2,400 percent (see Figure 3). Such dramatic growth of unfunded liabilities over such a short period of time raises questions about what has been at the root of it. Exploring the reasons behind this trend is important. When the debt grows, so does the amount of pension contributions required to service that debt, which adds to the overall cost of running the plan.

To understand the system’s declining solvency, it is important to first identify the contributing causes. Financial reports prepared annually by TSERS allow us to examine in detail those factors contributing to this decline in solvency and commensurate run-up in pension debt. Specifically, this report examines those gain/loss factors that have added over $9.6 billion to TSERS pension debt from 2008 to 2017, essentially covering the time since TSERS was last fully funded.
Missed investment assumptions contributed the largest share — nearly $6.3 billion — to TSERS pension debt from 2008 to 2017, as Figure 4 shows. In addition to lackluster investment performance, other variables like negative amortization — failing to make contributions at a level sufficient to keep total unfunded liabilities from rising — added over $2.8 billion in unfunded liabilities. Legislative changes like cost-of-living adjustments (COLA) contributed another $1.2 billion. Each of these has played a role even though North Carolina has been more prudent than other states in its assumed rate of return, amortization policy, and COLA increases.
The legislature may provide a COLA increase if it does not require higher employer contributions to pay for it. In contrast, automatic COLA increases take effect regardless of the employer’s ability to pay for them. Automatic COLAs can create a situation where benefits can easily grow regardless of inflation and the fiscal health of the plan, which ultimately could lead to the growth of unfunded liabilities. North Carolina’s practice of ad-hoc retirement allowance increases has helped balance retiree purchasing power and employer contribution increases.
TSERS calculates the annual required payments so that the plan pays down a fixed amount each year to eliminate the current debt in 12 years. This “level-dollar” — or fixed annual cost — amortization method stands in contrast to the “level-percent” of payroll amortization method used by many pension plans. This method adopts a fixed percent of payroll for each year of the schedule and relies on an assumption of a growing payroll over time, effectively back-loading pension contributions and increasing risk. Using the level-dollar amortization method effectively front-loads debt payments, leading to savings in the long run while preventing the issues associated with missed payroll growth assumptions.
The 12-year amortization schedule reduces the total amount of payments because the unfunded liability shrinks faster and accumulates less interest. The Society of Actuaries recommends that amortization schedules not exceed 20 years, though the national average as of fiscal year 2017 was 26 years.[1] Other things being equal, a longer amortization period raises the cost of the debt and exposes the plan to greater financial risk for a longer time. For example, if TSERS were to increase the funding period to 30 years, it would pay a total of $13.3 billion in amortization payments, as opposed to $7.6 billion under the current 12-year amortization schedule.[2] A shorter amortization period also reduces actuarial and investment risks of accruing more debt if investment returns continue to underperform in the future. The current length of the amortization period is beneficial for TSERS because it ends up costing less for the plan than a longer amortization schedule would.

Unlike other debt contributors, changes to pension assumptions — such as changes in expected investment gain and demographic assumptions — represent the adoption of more accurate plan assumptions and prudent operating policies. Although the related increase in pension debt in and of itself may seem concerning at first glance, it should be viewed in the context of proactive management. As managers implement more realistic assumptions such as lower discount rates, a lower assumed rate of return (ARR), updated mortality tables, and the like, unfunded liabilities may increase in the short run because of the implicit recognition that those liabilities have historically been underpriced for too long. Such prudent assumption changes should be viewed as proactive management, signaling that TSERS officials are serious about paying down pension debt in the long run.
The “Other” category in Figure 4 accounts for increased unfunded liabilities from changes due to transition to a new actuary, resulting in differences in methodologies and the changes in assumptions and methods based on the experience study conducted in 2015.
Recent Policy Changes
In this section we will briefly review some of the recent changes to TSERS that reflect prudent financial management practices. These are important incremental changes that will help keep the system on solid financial footing, though they also have to be viewed in the context of overall declining solvency of the plan, because that indicates more changes are still needed.
Fiscal Integrity/Pension-Spiking Prevention Act
The Fiscal Integrity/Pension-Spiking Prevention Act is a law enacted by state policymakers in 2014 to cap benefits to curtail the practice of so-called “pension spiking.” The change prevents the agencies participating in TSERS from incurring significant unanticipated liabilities caused by late-career compensation hikes. The pension-spiking measure only applies to employees that retire with an inflation-adjusted average final compensation (AFC) of $100,000 or more. The law helps protect pension assets by limiting the ability of highly compensated employees to artificially “spike” their final average salaries with things like extra overtime pay in the years immediately preceding retirement as a way to increase monthly pension payouts.
The law is well-meaning but remains limited in scope; the majority of those eligible for TSERS retirements fall below the required AFC benefits and remain unaffected. As a result, the legislation is estimated to have only saved $6.8 million in the first two years of implementation, a relatively small sum for a multibillion-dollar pension system such as TSERS. [3]
Lowering the Discount Rate
The TSERS board has also taken a proactive step in lowering the discount rate from 7.5 to 7.0 percent. The discount rate helps determine the present value of pension liabilities. Actuaries use the discount rate to calculate TSERS’ actuarially accrued liability (AAL) — the net present value of promised future pension benefits — and other vital statistics such as contribution rates and the plan’s funded ratio. The discount rate reflects the risk that the plan sponsor will not be able to pay the promised pensions. It is composed of the risk-free interest rate and an implied risk premium. The lower the discount rate is, the higher the actuarially accrued liability will be, and vice versa. In our view, the lower discount rate that TSERS has adopted reflects a more realistic understanding of the value of promised pension benefits.[4]
Lowering the Assumed Rate of Return
TSERS managers have been fiscally prudent by lowering the plan’s ARR for investments from 7.25 to 7.0 percent over the last several years. That said, additional reductions may be needed to better align with more accurate long-term market expectations. The ARR is fundamental in projecting pension debt liability, and when actuarially smoothed investment returns fall below the ARR, unfunded pension liabilities grow, all things being equal. Likewise, when the actuarily smoothed investment returns exceed the ARR, the pension liability falls, which may contribute to a decrease in unfunded actuarial liability.
Current Investment Portfolio and Expectations
The growth of TSERS’ pension debt didn’t happen overnight. Rather, it degraded over more than a decade and was primarily driven by missed expectations for investment returns. Post-recession investment returns have failed to consistently meet the ARR. As shown in Figure 5, from 2001 to 2017, the average annual market value investment return was 6.32 percent, significantly below TSERS’ current 7.0 percent ARR implemented in 2018 (the year the ARR was lowered from 7.25 percent). As a result, strong returns in the early 2000s have been offset by missed expectations after the 2008 financial crisis; all but one year since 2008 has seen actuarial losses, and thus growing unfunded liabilities.

Figure 5 includes the dot-com bubble and the Great Recession, but it also includes periods of booming investment returns. Assumed rates of return are supposed to estimate a long-run rate of return, which would account for economic fluctuations. Strong investment returns in fiscal year 2017 lifted pension systems across the country, including TSERS, with a 10.8 percent return that fiscal year, and 13.5 percent on a calendar basis. But years like 2017 are not indicative of the current or expected future norms.[5] TSERS achieved a 7.3 percent return in fiscal year 2018 and a 1.5 percent loss on a calendar year basis. Returns for fiscal year 2019 dipped to 6.6 percent, slightly below the expected 7.0 percent return.[6]
The current era of lower investment returns relative to historic norms is often referred to by financial economists as the “new normal.” Moreover, it is estimated that returns from equities (29 percent of the TSERS portfolio) over the next 20 years will be between 20 percent and 50 percent lower than today, and that real returns on fixed income (29 percent of the TSERS portfolio) may become negative.[7]
Given such changes, North Carolina state officials have been fiscally prudent by lowering the plan’s ARR from 7.25 to 7.0 percent, but, as will be discussed in the following sections, additional reductions may be warranted to better align with dampened long-term market expectations.
In contrast with the limited movement on the ARR assumption to date, TSERS has dramatically increased the volatility of its investment portfolio to achieve higher investment returns in response to the “new normal” environment. Figure 6 demonstrates how the TSERS investment portfolio has taken on greater investment risk since 2003. The share of fixed income (generally considered the safest asset class) and equities (riskier, but still generally considered safe) has declined, as investment in real estate and other alternative investment classes has grown. In 2003, high risk or low transparency assets totaled less than 4 percent of the pension fund’s allocation. By 2017, that had grown to 29 percent of the TSERS fund allocations.
Part of the expansion of riskier assets in the portfolio was the result of Senate Bill 558 of 2013, which removed some restrictions on TSERS’ ability to invest in high-yield, high-volatility assets, giving the plan more investment flexibility. At the time, the motivation behind the move towards riskier assets was the relatively modest performance of the more conservative portfolio in the prior years. However, the state’s General Assembly had been allowing investment in riskier assets to grow from 5 percent to 25 percent between 2000 and 2013 without seeing any improvements to TSERS’ fiscal solvency. In fact, TSERS’ funded ratio has been significantly declining throughout the same timeframe. Perhaps lowering the assumed rate of return instead of exposing the plan to greater risk would have been a more effective strategy at the time.

Despite employing an increasingly aggressive investment strategy, sub-par returns have played a substantial role in fueling the current unfunded liability. This suggests that, like many other U.S. public pension plans today, North Carolina TSERS has been intentionally expanding investment risk-taking and nonetheless is not seeing corresponding benefits; unfunded liabilities have been increasing, not decreasing.
Employer Contribution Practices
The Actuarially Determined Employer Contribution (ADEC) for TSERS — the contribution rate actuaries estimate is required from the employer to ensure future pension solvency — was 11.98 percent of payroll in FY 2019. The state established a 12.29 percent contribution to cover this and a one-time supplemental payment to retirees. The ADEC for FY 2020 is 12.97 percent.
The TSERS contribution rate is set each year by the North Carolina General Assembly after a recommendation of the TSERS Board, and the rate chosen may not be less than ADEC. The actual contribution made has matched or surpassed the ADEC through most of the plan’s recent history with few exceptions (Figure 7). This is one of many notable strengths of the plan and one that could allow the state to reach full funding sooner than many peers. No ADEC contribution was required in FY 2003, and the legislature provided less than the actuarially determined contribution in FY 2001 and 2011. Employer contributions in FY 2013, 2016, and 2017 exceeded ADEC, and those through FY 2020 have all met ADEC and any legislative adjustments to benefits.

However, achieving this has come at a notable expense, as employer contributions have grown from 3 percent to over 12 percent of payroll in the last decade. The rising employer contribution rate indicates that the cost of the pension plan is increasing as a share of total payroll. In 2016, the TSERS Board implemented the Employer Contribution Rate Stabilization Policy (ECRSP), which requires annual 35 basis point increases in employer contributions. Although paying the full ADEC is a practice that should be sufficient to keep the plan on track with its goals, this mechanism could create a cushion when the ADEC is either miscalculated for a prior year or for some other reason is not paid in full.
2. TSERS Risk Assessment and Contribution Forecast
In this section, we will look at the behavior of employer contribution rates and the TSERS funded ratio using deterministic and stochastic risk assessment techniques.
The deterministic model of investment returns means that our outcomes were precisely determined through assigning a specific value of investment return, without assuming any random variation. Specifically, we will use a constant rate of return over a certain time frame. For example, if we assume a 7.0 percent assumed investment return in a deterministic scenario, it will mean that each year the investment returns will be exactly 7 percent. In other words, we assume a constant rate of return over a distribution of years.
When using the stochastic approach, we will take our analysis one step further. In particular, we will provide a stochastic — or randomly determined — analysis of the funded ratio and employer contributions. We will examine how the plan’s asset return assumptions and experiences affect the risk of underfunding and contribution rate fluctuations. Investment returns inherently fluctuate from year to year due to an array of economic and political factors that cannot be easily predicted. The assumption that the plan is making — a 7 percent long-term ARR in the case of TSERS — is that of an average rate of return over a period of decades. However, even if the plan can expect a long-run compound return of 7 percent, some years will bring a higher return and others a lower return due to normal market fluctuations. So, stochastic analysis will allow us to account for the market fluctuations that the deterministic approach fails to account for.
Deterministic Risk Assessment
Table 1 shows the probabilities of meeting different long-run rates of return based on capital market forecasts published annually from major financial institutions, combining the asset allocation and reported expected returns by asset class as reported by TSERS with forecasts of returns by asset class generated from JP Morgan, BNY Mellon, BlackRock and Research Affiliates to produce probability estimates over a 20-year horizon.
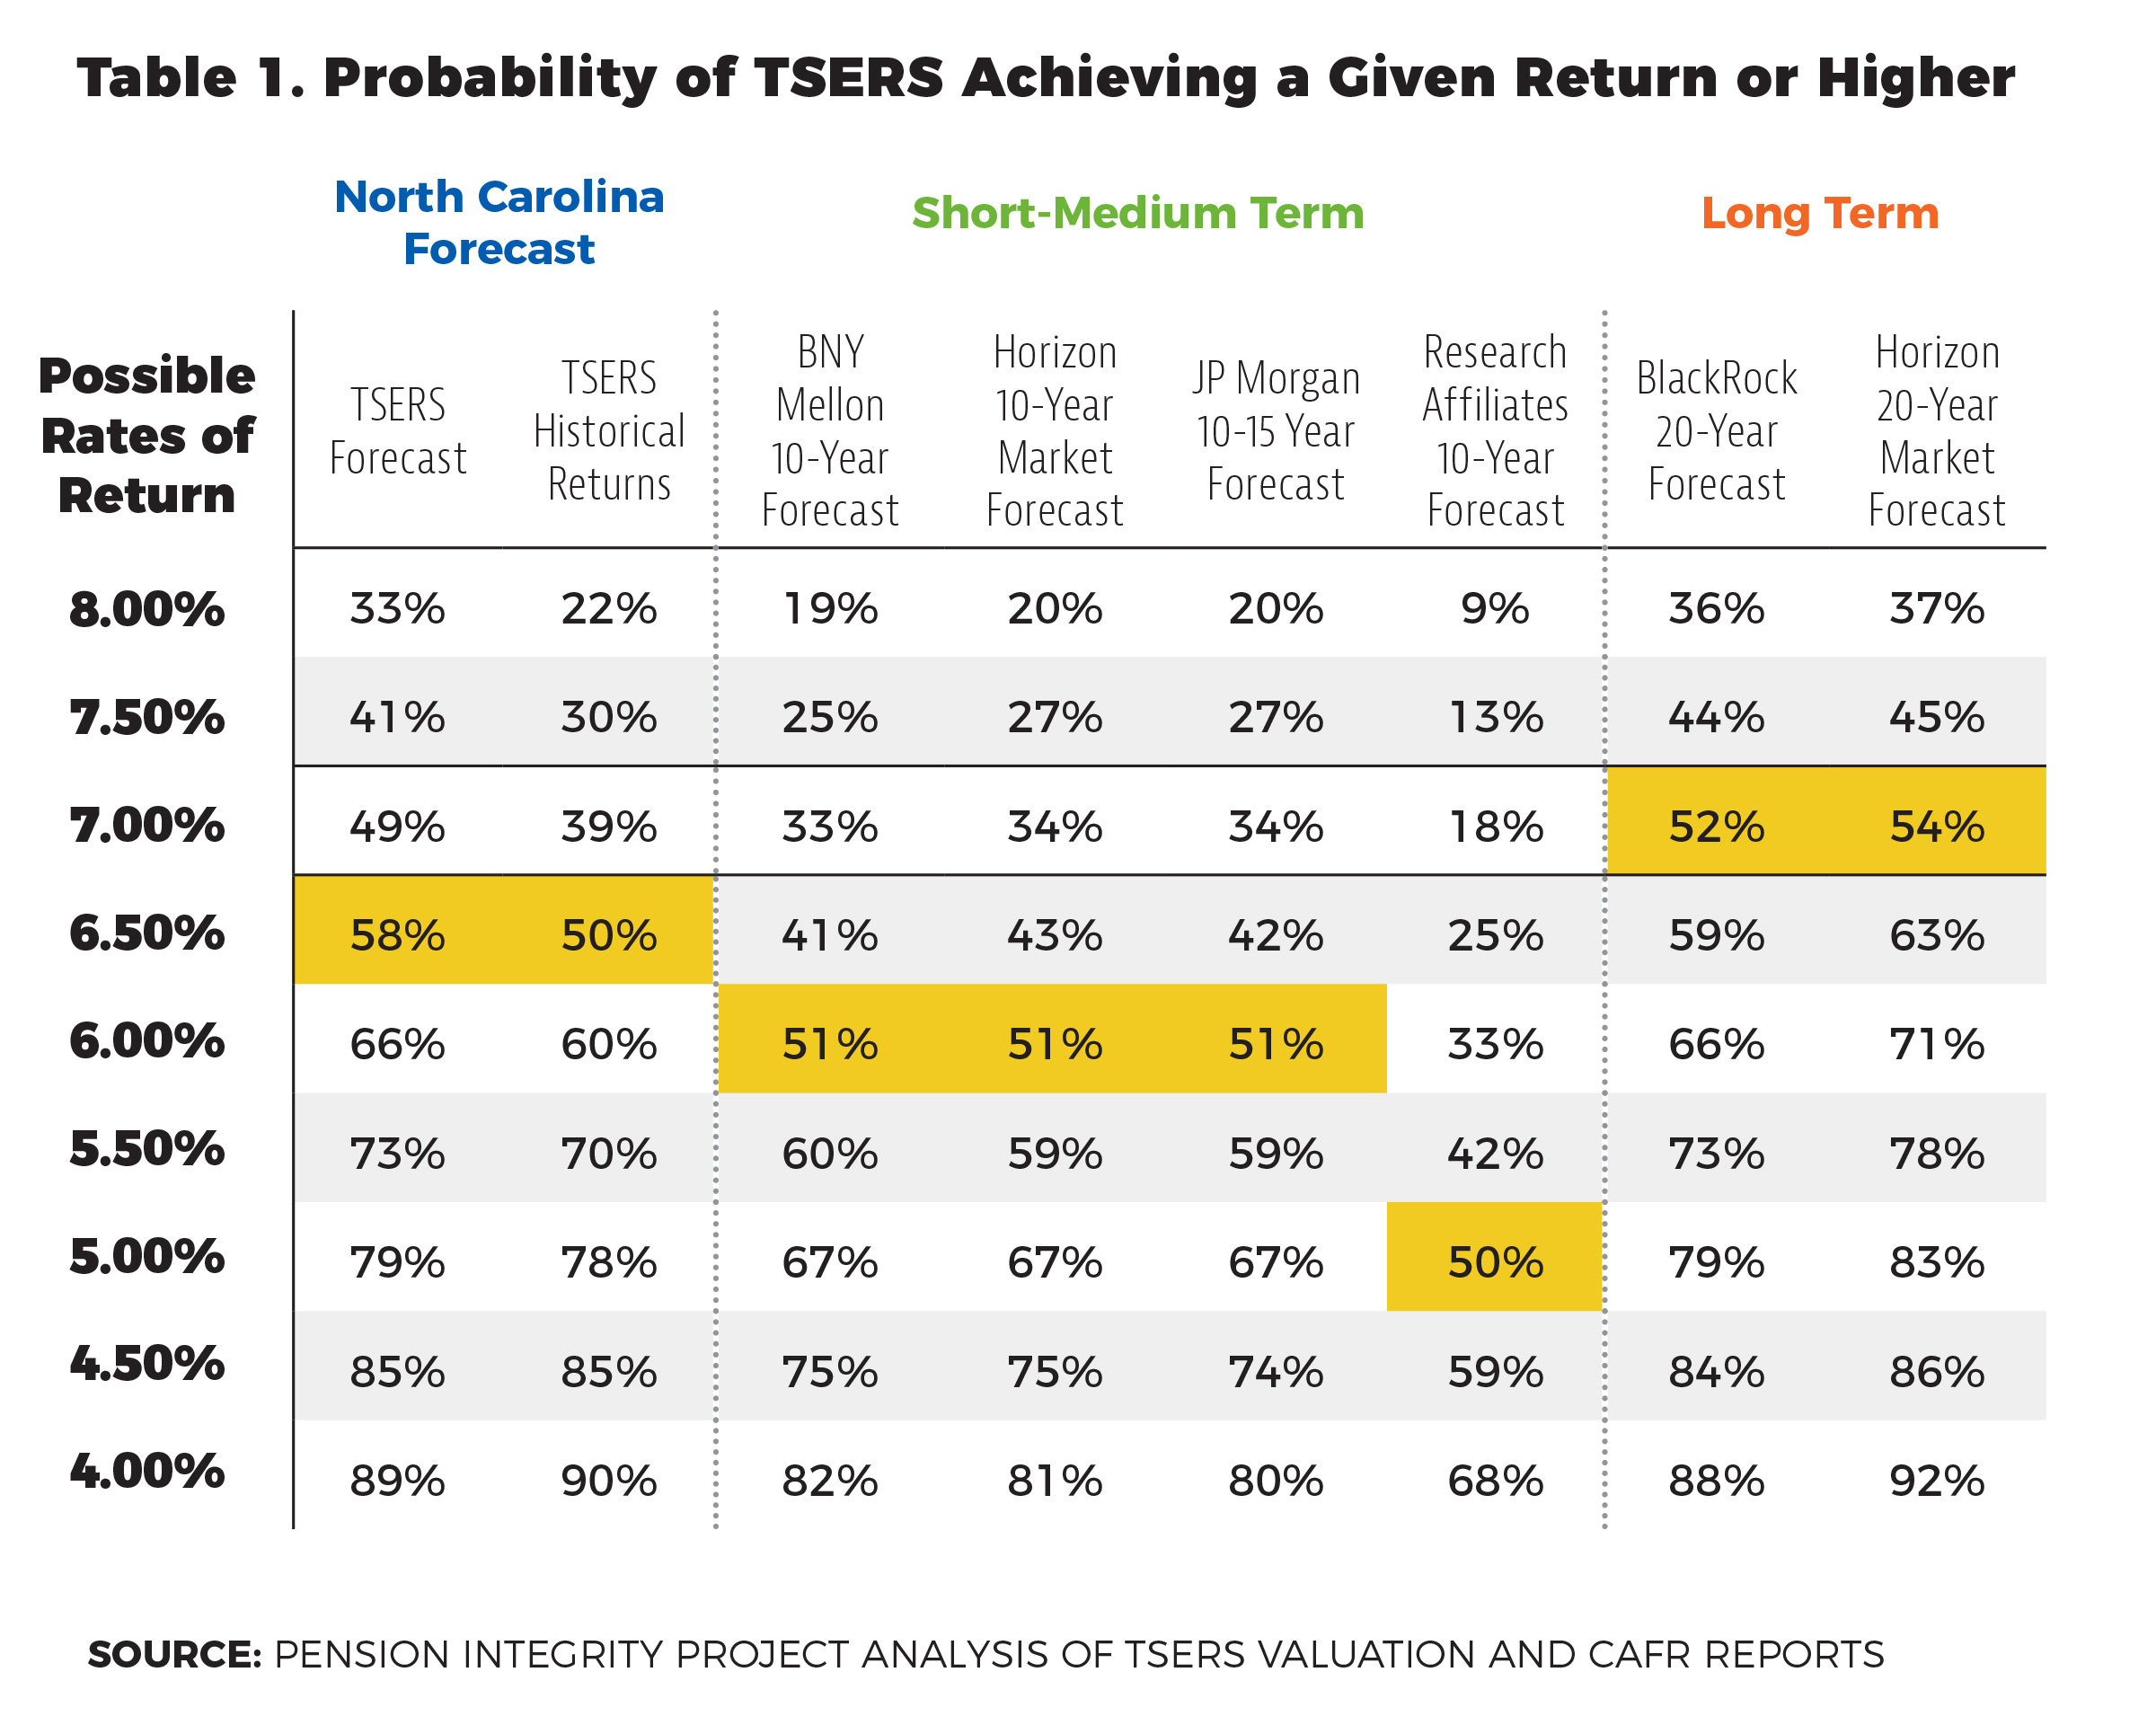
The results suggest that achieving the 7.0 percent ARR may be a challenge. Analysis of capital market assumptions publicly reported by the leading financial firms (BlackRock, BNY Mellon, Horizon, JPMorgan, and Research Affiliates) suggests that in the short-medium term (10-15 year period), TSERS returns are likely to fall short of their assumption. Even a 6.5 percent ARR has less than a 50 percent chance of being met in the short-medium term, according to our analysis. The implications of such underperformance in the future for TSERS is that the system will be structurally underfunded absent additional reforms. Failure to meet the ARR increases the cost of the plan through inaccurate calculation of ADEC and greater contributions needed to cover past shortfalls.
Forecasts showing long-term returns of 7.0 percent reveal a significant chance that the actual long-term average will fall below the plan’s ARR. For example, according to BlackRock’s 20-year forecast, while the probability of achieving an average return of 7.0 percent or higher is about 52 percent, the probability of earning a return below 5 percent is about 21 percent.
Even though long-term projections might look optimistic, they should be treated with caution. Long-term projections assume TSERS’ investment gains will revert back to the historical average. The “new normal” of lower investment returns and other market conditions could increase uncertainty over longer projections, and affect TSERS employer contributions, which are highly contingent upon the ARR.
Slight changes in returns have notable impacts on the employer’s contributions needed to keep the plan solvent, as shown in Figures 8 through 11. The lower the ARR goes, the higher the projected employer contributions grow. Figures 8 through 11 show projected employer contributions under four different deterministic return scenarios. Figure 8 shows employer contributions under the current TSERS ARR of 7.0 percent. We see that contributions peak in the years 2022 and 2023 and eventually go down and stabilize.


Figures 9 and 11 show employer contributions if investment returns are 5.5 percent and 6 percent. As we have shown in Table 1, according to our forecast, TSERS has an almost 60 percent chance of gaining returns of 5.5 percent or lower based on a 10-15 year forecast. Figure 11 shows that under the 5.5 percent scenario, employer contributions more than double the plan’s baseline contributions. Under a 6 percent scenario, the employer annual contributions are fluctuating around 11 percent. Similar to the 5.5 percent scenario, this is a significant departure from current plan assumptions.
Figure 10 shows the employer contributions and funded ratio if TSERS experiences another crisis, followed by a constant return of 7 percent. In this case, contributions are likely to spike past the 20 percent mark between 2022 and 2024, but gradually improve, dropping to a 6 percent minimum contributions level by 2034.
Stochastic Risk Assessment
In order to account for the uncertainty of various return realizations, we use the Monte Carlo simulation technique in this risk assessment. Monte Carlo simulations help us model the probability of different funding outcomes that cannot be easily predicted because of their stochastic (random) nature. To look at the impact of timing on returns, we are using a simulation model that calculates year-by-year finances of the plan, where investment returns vary from year to year. A single simulation (or run) of the model, constituting one “lifetime” for a pension plan, calculates the year-by-year finances of the plan for the next 30 years.
In this section we will use two types of returns or, rather, two types of assumptions about the expected returns. What we will label as the “plan’s baseline” returns are the expected gains based on TSERS’ assumptions regarding investment returns and their respective volatility. What we will label as “market baseline” returns are returns that we obtain by using the plan’s asset allocation and matching them against benchmark returns of four external firms (BNY Mellon, JP Morgan, Research Affiliates, and BlackRock)[8]. Since asset returns obtained from the external firms are lower (see Table 1), we end up with lower expected returns.
The information on both the market and assumed returns (as well as volatility) allows us to run two different scenarios: a market baseline scenario and one based on the plan’s assumptions — the plan’s baseline scenario. Each scenario includes 10,000 runs, where investment returns vary not only from year to year but also from simulation to simulation, creating 10,000 different possible futures. All returns are assumed to be independent and follow a normal distribution. The expected long-term return varies, depending on the scenario. By summarizing results for 10,000 simulations, we can estimate probability measures such as the expected funded ratio and employer contributions for the next 30 years.
Figures 12 and 13 show the results of the Monte Carlo simulation. Figure 12 shows the range of outcomes under TSERS’ assumptions, whereas Figure 13 demonstrates the range of outcomes under a market baseline scenario with lower investment returns. The orange line shows the expected outcome or the median of possible outcomes. However, because of the asset return volatility, there are numerous variations, and the blue bars show the range of possible outcomes between the 25th percentile (the very bottom of the shaded wedge for each year) and the 75th percentile (the very top of the shaded wedge in the same time frame.) The 75th percentile is the optimistic outcome, meaning that 75 percent of the time the funded ratio will be below the top of the shaded wedge. The 25th percentile is a pessimistic outcome, which means that only 25 percent of the time the funded ratio will be lower than the bottom of the shaded wedge. The results also demonstrate that 50 percent of the possible outcomes will be within the shaded wedge shown in the graphs.


Under the 7.0 percent scenario, the probability of the funded ratio dropping under 80 percent is above the 25th percentile line. The 25th percentile means that 25 percent of the time the funded ratio will drop lower than the bottom of the shaded wedge. This simulation accounts for the volatility, meaning that even if all the assumptions and return expectations are accurate, the range of possible outcomes can vary greatly. When accounting for market uncertainty, the plan might still not reach full funding, even if all assumptions are correct on average.
Analogous to the previous two figures, Figures 14 and 15 show the results of stochastic analysis using the Monte Carlo simulation, with the difference that the latter shows how the employer contribution rates perform under a variety of scenarios. When analyzing the estimates under the plan’s assumptions, we can see that the contribution rates can go as high as 17.5 percent in 2029 in the 75th percentile case. Under market assumptions, they go as high as 21.8 percent in the same year, in the 75th percentile case. It is important to note that employer contributions rates never go below 6 percent, which is the plan’s employer contribution minimum. Similar to the case with funding ratios, the 50th percentile shows the median outcome.


So far, when analyzing the behavior of employer contributions, we have based our logic on the idea of average returns. However, even if the long-term return assumptions are correct — e.g. the geometric average rate of return after a few decades is indeed 7 percent — the funding outcomes can significantly vary. The timing of returns, either weak or strong, can strongly affect employer contributions.
Figure 16 shows how weak early returns can impact employer contributions. Although all the scenarios shown have the same 7 percent average return throughout the 30 years, it is clear that contributions can differ significantly, depending on the timing of weak versus strong returns. In one hypothetical scenario where weak returns happen early in the 30-year period, employer contributions can grow up to 25 percent in year 2031. If early returns are strong, employer contributions fall to the minimum employer contribution of 6 percent as early as 2025.
There are two main takeaways from the above exercise. First, it makes it clear that TSERS’ assumptions regarding ARR and its consequences on contribution rates are somewhat optimistic. The market baseline scenario shows that actual contributions can potentially far exceed those predicted by plan assumptions. Second, even if the plan’s ARR of 7 percent is correct, the plan still carries a lot of risk, and contribution rates can still go significantly higher even if assumptions are correct.
This impact of timing of returns can be explained by the cash flow effect. A typical pension plan, like TSERS, receives contributions (cash inflows) and pays out benefits (cash outflows). Combined with volatile investment returns, the cash flow effect can produce distortions that lead to unexpected funding outcomes, as demonstrated in Figure 16. In each scenario shown, TSERS is assumed to achieve its average 7 percent investment return target over the full time period shown; what varies among scenarios is the timing of returns. If the plan experiences high investment returns in the early years, it gains more compounding interest over the years and required employer contributions fall. By contrast, if the plan experiences low returns early on, this negatively effects all future compounding returns. Negative cash outflows in the early years weaken the effect of the investment return in the years that follow.
As discussed previously, many experts expect investment returns for major asset classes over the next 10 to 15 years to be lower than the historical long-term average and 10-year expected returns are notably lower than the 20-year expected returns, according to a major survey of capital market assumptions. These estimates suggest that the chance of having weak early returns is probably higher than the chance of having strong early returns. This means this is critical for TSERS to account for the possibility of low returns short-term and for the consequences of this for the employer contributions. As we have shown, early weak returns can have a drastic impact on the dynamics of employer contributions going 30 years forward.
Beyond the analyses in the previous sections, we are also interested in knowing how much more additional risk TSERS needs to take in order to achieve the assumed return. In order to do that, we can analyze the plan’s portfolio “efficient frontier,” which shows the highest possible return it can expect from the portfolio, given different levels of risk.
Since we know the TSERS portfolio allocation, we can calculate how much additional investment risk would need to be taken to achieve the plan’s goals. Figure 17 shows the average return rate based on plan assumptions and the associated volatility. According to Figure 17, in order to achieve a 7 percent geometric[9] average (the plan’s assumption, reflecting compounding), TSERS needs to take additional risk, as expressed in the higher volatility of 12.85 percent. This is a 2.15 percentage point difference from the current volatility rate of 10.70 percent. In what follows, we will discuss the implications of this finding for the projections of funding status and contribution rates.

In order to lower the risk associated with asset returns, the assumptions regarding the ARR should move toward the left of “Target” in Figure 17, meaning the plan should lower the ARR and associated volatility risk. As one can see from the figure above, volatility grows with greater ARR. The move towards higher ARR and greater volatility would open the plan to greater uncertainty. Because TSERS guarantees future pension benefits, it should consider moving to a less risky asset allocation, which would mean adopting a lower expected average return (or gradually stepping it down over time). As previously discussed, TSERS has been moving in the opposite direction, taking on more risk.
One reason for the current problem is that TSERS has only slowly adjusted to past reductions in the risk-free rate. The yield on 10-year U.S. Treasury bonds has been in a steady free fall since the early 1980s, and for nearly 30 years it has fallen below the TSERS assumed rate of return. The TSERS board only adjusted its assumed rate of return once between 1980 — when the rate jumped from 6.0 percent to 7.5 percent — and 2017, when the current round of reductions began. In 1997, the board inched the rate down to 7.25 percent.

Assessing Funding and Contribution Rate Volatility
It is also important to examine the likelihood of extreme fluctuations in key plan indicators because such events could pose direct risks to the government and stakeholders. These events could throw the pension system so far out of balance that they require political action. Typical political responses to extremely low funded ratios or extremely high employer contributions are raising taxes or cutting services.
Figure 19 demonstrates the probability of the TSERS funded ratio dropping below 40 percent in any year up to a given year — a level that is likely to generate a political response — under three different scenarios: plan baseline, market baseline and “aggressive.” We chose a 40 percent cut- off point because, according to prior research, this level is an indicator of a deeply troubled plan.[10] The probability increases over time because it sums the probabilities generated by all previous years up to a certain point in time. Scenarios modeled include:
- Plan Baseline: uses the same assumptions and capital market forecasts as TSERS (see discussion in section 2).
- Market Baseline: uses assumptions derived from the capital market forecasts provided by the four financial firms in Table 1 (BNY Mellon, JP Morgan, Research Affiliates, and BlackRock) and are the same assumptions used in section 2.
- Aggressive: This scenario assumes a higher risk/higher reward portfolio to account for the additional risk the plan would have to take in order to achieve the target ARR of 7.0 percent (illustrated by the move from the market baseline to the aggressive line in Figure 19). Additional risk means there will be added volatility to realized investment return outcomes. As a result, there will be greater chances of extremely high or extremely low investment gains.

The analysis shows very little risk of a TSERS crisis. The probability of TSERS’ funded ratio falling below a 40 percent crisis threshold by 2049 is 5 percent under aggressive estimates, 3.5 percent under market baseline estimates, and around 1 percent under current plan baseline assumptions. The “plan baseline” using TSERS’ high assumed rate of return has the lowest probability of crisis. The aggressive scenario, in turn, performs worst due to the higher investment risk. Regardless, it is highly unlikely that a plan currently 87.4 percent funded will fall below 40 percent funded unless there is a major shock to the system.
But even more modest declines in funded status should be of concern. In order to give the reader some perspective, we have also calculated the probability of the plan’s funded ratio dropping to 70 percent under the plan’s own assumptions, which is almost 44 percent in any year up to 2049 and rising to 65 percent using market baseline estimates (Figure 20). As of 2018, the average funded ratio among U.S. public pension plans was 72.6 percent. Therefore, we chose 70 percent as an approximate cut-off point that shows us the probability of the plan’s funded ratio dropping below the national average.

Rising employer contributions mean that the cost of a pension plan is increasing for the employer on an absolute basis, and it can result in increased fiscal pressure on the state and constituency that supports the plan unless the state’s revenue is rising faster at the same time. This is why tracking the probability of employer contributions growing beyond a certain point is critically important.
Figure 21 shows the probability of the employer contribution rate rising by more than 10 percent of payroll in any five-year period prior to a given year. This is where latent risks become more visible. The analysis suggests that by 2051, depending on the scenario, there is between a 33 percent and a 53 percent chance that employer contributions will grow by more than 10 percent of payroll in any five-year period.

The results of our simulations lead us to two important conclusions.
First, although TSERS has a low risk of underfunding overall, it may face significant contribution volatility, which would be especially damaging if the plan experiences low investment returns in the short term. It could even experience contribution challenges if expected returns of 7.0 percent are realized over the long run. Further, as we indicate in section 2, plan administrators may feel pressure to take on additional risk to reach a target ARR, which implies even more volatility and therefore added risk and uncertainty. Instead of bringing higher returns, this added volatility and risk could further degrade the fiscal solvency of the plan.
Second, the practice of having an employer contribution floor ensures the plan avoids dramatic drops in contributions. Although this alone does not guarantee the plan full funding or long-term solvency, it does somewhat protect the plan from extremely low contribution rates that jeopardize appropriate funding of the plan. This policy is a sort of “insurance” for the plan. Paying the minimum contribution rate even when the plan is fully funded and the ADEC is lower than the minimum rate provides the plan extra cushion in market shocks. Because the contribution floor (6 percent of payroll) is significantly below the current ADEC
(12 percent of payroll), it is unlikely to generate additional employer contributions in the near term. As a result, the floor should not be viewed as a long-term solution to the plan’s declining funding ratio.
Third, as we have noted in section 2, the present 7.0 percent ARR is only likely to be reached with an asset allocation that has high volatility, exposing the plan to even greater uncertainty regarding future investment returns. These results have to be reviewed with an understanding that, over the past 20 years, TSERS has been gradually introducing riskier assets into its portfolio without much to show for it, since the funded ratio has been declining. It should be made clear that introducing riskier assets does not guarantee higher returns and increased fiscal health of the plan. In fact, as has been demonstrated by both historical performance and our projections, it might be detrimental to the plan’s financial solvency.
3. Pension Policy Objectives
The Pension Integrity Project at Reason Foundation considers the following seven objectives as a foundation for any policy agenda designed to improve public pension solvency and ensure the long-term sustainability of public sector retirement systems. Accordingly, any prospective policy agenda designed to improve TSERS solvency should be benchmarked to this framework.
- Keeping Promises: Ensure the ability to pay 100 percent of the benefits earned and accrued by active workers and retirees.
Paying promised pension benefits is not optional; they are deferred compensation that employers should take every effort to ensure are honored. For future employees, the retirement benefit design should emphasize retirement security by minimizing volatility and risk, while also taking care to avoid the problems of the past — even if that means offering new benefit designs or alternative cost- and risk-sharing methods. Currently, TSERS has 87 cents per each dollar owed. Although this is well above the national average of about 73 cents per dollar, economic conditions can deteriorate quickly. Thus, TSERS needs to strive to reach full funding of future benefits as soon as possible.
- Retirement Security: Provide retirement security for all future and current employees.
Ensuring that benefits are sufficient to preserve retiree standard of living is the primary goal of benefit design. The needs of different retirees will vary, but any benefits offered should be designed to ensure an employee’s standard of living won’t decline after they retire. Being relatively healthy among its peers from a financial perspective, TSERS has not experienced any fundamental changes to benefit design (e.g., new plan benefit tiers), unlike other similar systems. The declining funding ratio, however, might be a signal that some adjustments to new-hire benefit design need to be made to ensure the retirement security of future employees.
- Predictability: Stabilize contribution rates for the long term.
North Carolina has been generally consistent in contributing its full ADEC payment each year. However, future underperformance could jeopardize the fiscal health of the plan and increase volatility in required pension contributions, which would be challenging for state fiscal management and can create a perverse incentive to budget for contributions less than the actuarially determined contribution.
- Risk Reduction: Reduce pension system exposure to financial risk and market volatility.
Given structural economic shifts like the downward global trend in interest rates over the last two decades and what many experts see as a “new normal” of below-average asset returns, public pension plans should reduce investment risk and increase contributions, as well as lower their assumed rate-of-return assumptions. For many underfunded public pension plans, a large share of the unfunded liability is a result of underperforming investment returns relative to assumptions; this has accounted for $6.2 billion of the growth in TSERS pension debt since 2008. Instead of adjusting expectations and reducing risk, TSERS has expanded the share of riskier assets in its portfolio in an apparent attempt to chase higher returns. The board needs to exercise caution when balancing the low investment returns of safe assets and the high volatility of riskier assets.
- Affordability: Reduce long-term costs for employers, taxpayers, and employees.
By minimizing the costs for all parties involved, policymakers free up future resources for other projects. Consistent ADEC contributions and the use of short amortization schedules currently helps to drive down long-term costs in TSERS.
- Attractive Benefits: Ensure the ability to recruit 21st-century employees.
For the government to run well, it must be able to attract talented employees. Changes in labor markets have changed the demand for fixed pensions versus flexible, portable retirement benefits, as well as preferences for a higher salary today over better long-term benefits. Lifestyle preferences vary by region, so an employer should consider the specific considerations of employees in its jurisdiction for what 21st-century employees prefer. For example, employees at public universities in North Carolina currently have the option of choosing the state’s Optional Retirement Program instead of a traditional pension, offering the flexibility of transferring retirement savings from one employer to another. This is a professionally managed retirement plan that lets the employee control her investment choice and retirement goals. Offering a variety of retirement options creates new choices and customization opportunities for employees, thereby expanding the potential pool of new workers for TSERS. Some of those options could better balance cost and risk-sharing between employers and employees in the event of underperforming investment returns, missed actuarial assumptions, and increased volatility.
- Good Governance: Adopt best practices for board organization, investment management, and financial reporting.
During pension crises, it is easy for other political interests to hinder pension reform, making the whole government worse off. Ensuring the long-term solvency of TSERS means aligning the incentives of the pension fund administrators and decision-makers by fixing decision-making processes and ensuring they have a stake in the long-term solvency of the plan. TSERS has robust pension oversight practices that allow for timely decision-making and appropriate changes like lowering the assumed rate of return and giving out cost-of-living adjustments (COLAs) only when fiscally feasible. Nonetheless, the TSERS Board could benefit from reducing the assumed rate of return in order to keep the plan well-funded.
4. Recommendations to Reduce TSERS Risk and Ensure Fiscal Sustainability
While TSERS is performing better than most peer retirement systems, the preceding analysis also highlights significant risks and areas for continued improvement. In order for TSERS to keep promises and provide attractive benefits to future employees, it needs to consider additional changes, such as adopting a lower assumed rate of return, more conservative actuarial assumptions, and considering the introduction of alternative, risk-managed plan designs that give employees more ability to customize their retirement plans to their professional and personal goals.
Adopt More Conservative Actuarial Assumptions
Pension plan administration is most effective when it relies upon the use of conservative actuarial and demographic assumptions that the plan can consistently meet. The investment return assumption is one of the critical assumptions that keep a pension plan on track from a financial perspective. This is because assumptions about investment returns feed into the calculation of actuarially required pension contribution rates. A high assumed rate of return (ARR) will result in lower annual contributions to the pension system. While employers and employees may be required to pay the full actuarially determined contribution rate each year into a given pension system, if that contribution rate is underpriced by the assumptions, the plan is still being underfunded.
As we have shown in Part 2 of this paper, missing a target ARR leads to higher unfunded liabilities and employer contributions that make running the plan more expensive and encroach upon other public spending. A quick review of Table 1 calls into question the ability of the fund to reach its 7.0 percent ARR over time. Currently, our analysis of expected returns based on external firms’ forecasts show a less than 40 percent chance of achieving the current 7.0 percent ARR over the next two decades. The implication for TSERS is that it may be implicitly structurally underfunding the plan by using an ARR higher than can be reasonably expected. Failure to meet the ARR over the long term increases the contributions needed in order to cover past shortfalls. This creates a chronic underfunding issue.
In addition, even if the current 7.0 percent ARR is achieved over the long run, our Monte Carlo analysis shows that the timing of returns alone can impact solvency, and poor performance early on can lead to higher contribution rates and underfunding issues. What’s more, TSERS has been introducing a number of riskier assets prone to additional volatility that causes uncertainty about investment returns (see Figure 6). As we have demonstrated in section 2, introducing a riskier asset allocation could lead to significant fluctuations in employer contributions and funded ratio.
Given these risks, it would be prudent to reduce the risk of missing the target ARR.
Although a more realistic ARR would mean higher contributions to the plan by the employer, higher contributions would reduce the long-term risk associated with uncertain and volatile market returns. This is because the plan’s unfunded liability would grow less if the employer contributions are at the appropriate level. As a result, adopting a more realistic ARR would help avoid even more in unfunded liability amortization payments spread out over future budgets.
While lowering the ARR for the pension plan overall would require a commensurate increase in the aggregate contributions needed on an annual basis (since you would be assuming less in investment returns over time), there is one conceptual way to make such a change fiscally feasible. That is to introduce a new defined-benefit pension plan tier for new hires that is, in all respects, indistinguishable from the current pension plan, with the exception that it instead uses an ARR for the new tier that is legislatively capped at, for example, 6 percent or lower in order to reduce risk.
In addition to ARR, the discount rate (DR) needs to be updated. It is important to note that the ARR and DR — terms often used interchangeably by pension system administrators and their actuaries — are completely different concepts that need to be understood in order to better understand pension risk.
The DR is used to determine the present value of all future pension liabilities. Actuaries use the DR to calculate actuarially accrued liability (AAL) — essentially the sum total in today’s dollars of all promised pension benefits — and other vitally important elements such as contribution rates and the plan’s funded ratio.
The DR is composed of the risk-free interest rate and a risk premium (i.e., risk-free interest rate + risk premium = discount rate). U.S. Treasury bonds — which incorporate the time value of money and reflect the expectation by bondholders of a very low risk of federal government default — can serve as a proxy for the risk-free rate. The risk premium reflects the default risk of the underlying security: the riskier the security, the higher the risk premium. Unlike federally issued Treasuries, states have budget constraints and do not issue currency. Public pensions are basically underwritten by the taxpayers. If the pension fund becomes insolvent, then public officials will most likely take money from general tax funds to make up for pension losses. The aforementioned thus implies a risk premium of zero, yet we see a significant gap between the TSERS discount rate of 7.0 percent and the much lower yields on U.S. Treasuries (generally in the 2.0 percent to 3.0 percent range in recent years).
Since 2001, 30-year Treasury yields have declined from 5.5 percent to around 3 percent today. To keep pace with the changing market environment, TSERS’ discount rate should have been lowered accordingly (see Figure 22). If we call the difference between the risk-free rate of return (30-year Treasury yield) and the discount rate the “implied risk premium,” we can see that the implied risk premium has increased from 2 percent in 2000 to 4.5 percent today. In theory, this would imply that the probability of TSERS defaulting on its pension debt has more than doubled, but that is clearly not the case since pension benefits are constitutionally protected. It may be conceptually better to consider the “implied risk premium” to reflect additional risks that are willingly or tacitly being embraced by the plan that are to some degree driving the debt financing of some portion of promised pension benefits.
Recalculating the plan’s funded ratio using a lower discount rate leads to the following results: the plan’s total liability jumps to $129 billion with discount rate of 2.75 percent — as opposed to $70 billion with the discount rate of 7.0 percent[11] — and the funded ratio drops from 87.4 percent to 54.7 percent[12].
In order to properly account for all liabilities, TSERS should lower its discount rate accordingly. Only then it will know the true value of its unfunded liabilities and will be able to determine appropriate required contributions. The inappropriate discount rate leads to undervalued pension liabilities, which leads to inaccurate calculating of the funded ratio and subsequent underfunding of the plan.
Consider Expanding New-Hire Retirement Plan Choices and Providing Options To Existing Employees
North Carolina TSERS has fared relatively well over the last two decades despite the financial challenges that have strained similar public pension systems. TSERS’ experience demonstrates there is nothing fundamentally flawed with the general structure of defined-benefit pension plans in and of themselves. Rather, the relative financial health among them tends to vary as a function of their structural plan design. Healthy public pension plans like those in states like North Carolina, Wisconsin, and South Dakota tend to have self-correcting design features and operate relatively conservatively, making them outliers relative to those plans that have seen significant solvency declines this century.
The prudent historical management of TSERS does not make the system impervious to the types of unanticipated risks that have made many public defined-benefit pension plans difficult to administer nationwide. We already see in TSERS a plan that has experienced a massive shift from overfunding to underfunding over the last decade, so conditions can indeed change quickly. In the realm of pension finance, the best time to make prudent changes to reduce risk is right now, before major problems (such as the next recession) materialize.
The creation of a multi-tier system could help address the issue of unanticipated risk and could also be an attractive benefit design from a human resources perspective. Creating a new risk-managed pension plan tier for new hires — one with the same benefit formula used today, but which uses more conservative assumptions (like an ARR with a 6.0 percent cap, for example), explicit cost-sharing provisions, and self-correcting mechanisms to prevent severe underfunding — could help lower risk and avoid growing pension debt in the future.
Such features have kept risk-managed pension plans in Wisconsin and South Dakota at or very near full funding despite weak economic market conditions over the past decade. Michigan and Arizona have both adopted major reforms in recent years that placed new hires into similar cost- and risk-sharing plans. In the case of the newest pension benefit tier for Michigan teachers created in 2017, the new pension plan has the same benefit model as before, but it caps the assumed rate of return that can be used for that plan tier to a maximum of 6 percent and requires any new pension debt earned in a given year to be paid off over 10 years or less, not the previous period of several decades. Additionally, the full actuarially determined contribution is split evenly between employers and employees of the new benefit tier, which limits the state’s risk exposure.
It may also be prudent to consider expanding choices of retirement options for new hires as well. Florida, Pennsylvania, Michigan, Arizona, and Colorado are among the states that have moved away from one-size-fits-all pension systems in recent years and have opened up new retirement plan designs that allow employees to better customize their retirement savings to match their own individual circumstances and preferences. Typically, as in the case of Michigan, Florida, Colorado and Arizona, the choices are either a new risk-managed defined benefit (DB) pension plan (along the lines described above) or a defined-contribution (DC) retirement plan. Pennsylvania, by contrast, now offers most state employees and teachers a three-choice menu that includes two different hybrid retirement plans (combined DB pension and DC plans, akin to the federal Thrift Savings Plan) and a DC retirement plan.
Cash balance plans are another form of guaranteed return plan (like a DB pension) option that guarantees a certain rate of return on investment but does so at less risk than the typical pension system because the guaranteed investment return is lower (say 4 percent, instead of the current 7 percent guaranteed investment return of TSERS). If investment returns for a given year fall below this figure, taxpayers would make up the difference (though the probability would be low). If investment returns exceed this figure, then the plan splits the upside difference between plan members and the employer (via an overcontribution to the cash balance fund to create a cushion for later).
As policymakers consider ways to improve TSERS’ solvency and look to build the future state workforce, considering the introduction of new, low-risk retirement choices may be a prudent path forward.
Conclusion
North Carolina’s Teachers’ and State Employees’ Retirement System (TSERS) is considered one of the healthiest pension plans in the country, and it currently applies many best practices for managing retirement systems. However, our analysis has revealed several weaknesses of the system that could jeopardize its fiscal health in the long run.
Our analysis of the causes of the growing unfunded liabilities has revealed that underperforming investment returns are the primary cause of the growing pension debt, and the plan’s assumptions about investment returns are overly optimistic. Although TSERS has made some changes to its assumed rate of return over the past years, it still remains too high. Moreover, in order to achieve the target assumed rate of return, TSERS is likely to have to introduce even more risk — and therefore greater uncertainty and potential volatility — to the plan. As we have demonstrated, added uncertainty leads to higher fluctuations in both funded ratio and employer contributions.
TSERS is already displaying fiscal prudence through employing an actuarially determined contribution policy. However, if the assumptions, like overly-optimistic rate of return, that go into calculating employer contributions are incorrect, then paying the annual actuarial bill in full will not lead to full funding.
Other than lowering the target rate of return, TSERS should consider changing the discount rate. Inaccurate use of discount rate leads to an underestimated level of liability, which leads to lower than needed employer contributions. This can have detrimental consequences for the plan going forward.
Last, in addition to adopting more conservative assumptions, TSERS should explore the possibility of introducing retirement plan choices that include, for instance, a risk-managed defined-benefit pension, cash balance plan, or defined-contribution retirement plan that will further reduce the risk of underfunding.
North Carolina’s TSERS provides a valuable service to its members and has been an example of smart pension management for years. In order to keep providing competitive benefits for existing and future employees, it needs to consider incremental changes to the plan today that will pay off greatly in the future by preserving benefits and ensuring fiscal sustainability in the long run.
Endnotes
[1] Author calculation of weighted amortization period average Public Plans Database (PPD).
[2] The total amounts of amortization payments are calculated assuming there is no minimum required employer contribution of 6 percent.
[3] Brief: The Anti-Pension Spiking Contribution-Based Benefits Cap at Two Years Old, an Evaluation
[4] Bui, T., Randazzo, A. Why Discount Rates Should Reflect Liabilities: Best Practices for Setting Public Sector. Reason Foundation
[5] Niraula, A., Takash, D. Preliminary Reports Suggest Favorable Investment Returns for Pension Funds in 2017. Reason Foundation, August 2017
[6] North Carolina Department of State Treasurer, Investment Reports.
[7] McKinsey Global Institute. 2016. Diminishing Returns: Why Investors May Need to Lower Their Expectations. McKinsey and Company.
[8] Note that we do not include Horizon’s capital assumptions from Table 1 since Horizon’s assumptions are based on the aggregation of other firms’ assumptions. Including Horizon’s assumptions in this calculation would amount to double counting.
[9] Geometric return is used when calculating average rate per period on investments that are compounded over multiple periods, as opposed to arithmetic average that is calculated simply by adding the returns for all sub-periods and then dividing by the total number of periods.
[10] Rockefeller Institute of Government. 2016. Public Pension Funding Practices. How these practices can lead to significant underfunding or significant contribution increases when plans invest in risky assets. D. Boyd and Y. Yin.
[11] Authors calculations using NC TSERS 2018 CAFR.
[12] Authors calculations using NC TSERS 2018 CAFR.