


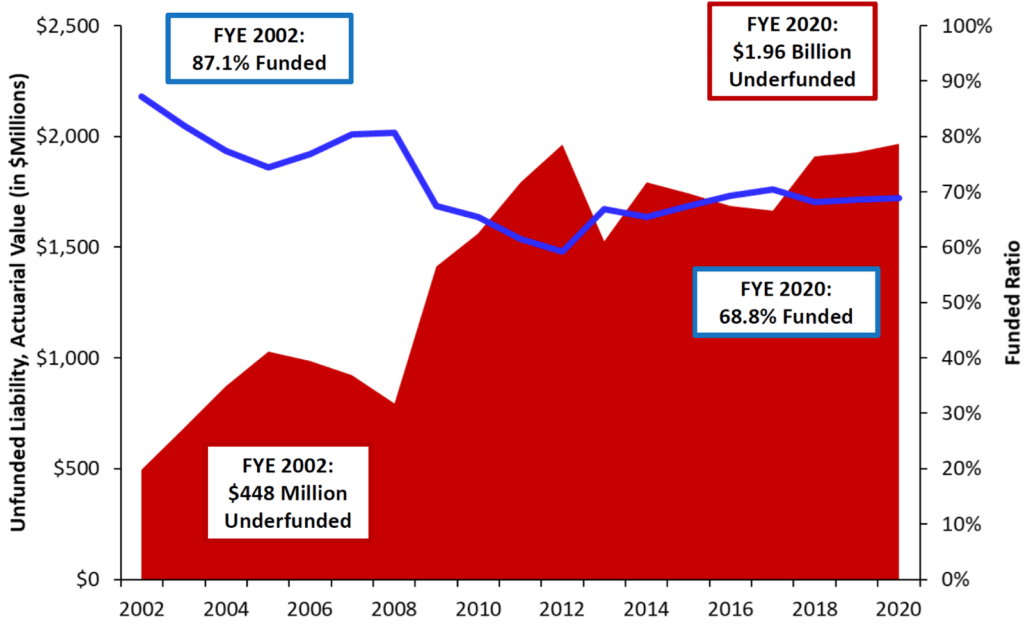
The solvency of the Montana Teacher Retirement System (TRS) has been declining for two decades. In the year 2002, the public pension plan which serves Montana educators was overfunded by nearly $500 million, but today the plan has over $1.96 billion in debt.
This debt is putting a strain on schools and taxpayers in the state.
The latest analysis by the Pension Integrity Project at Reason Foundation, updated this month (February 2021), shows that deviations from the plan’s investment return assumptions have been the largest contributor to the unfunded liability, adding $897 million since 2002. The analysis also shows that failing to meet investment targets will likely be a problem for TRS going forward, as projections reveal the pension plan has roughly a 50 percent chance of meeting their 7.5 percent assumed rate of investment return in both the short and long term.
In recent years TRS has also made necessary adjustments to various actuarial assumptions, exposing over $400 million in previously unrecognized unfunded liabilities. The overall growth in unfunded liabilities has driven Montana’s pension benefit costs higher while crowding out other education spending priorities in the state, like classroom programming and teacher pay raises.
The chart below shows the increase in the Montana Teacher Retirement System’s debt since 2002:
Left unaddressed, the pension plan’s structural problems will continue to pull resources from other state priorities.
The full Montana TRS solvency analysis also offers stress-testing designed to highlight potentially latent financial risks the pension system is facing. Reason Foundation also highlights a number of policy opportunities that would address the declining solvency of the public pension plan. A new, updated analysis will be added to this page regularly to track the system’s performance and solvency.
Bringing stakeholders together around a central, non-partisan understanding of the challenges the Montana Teacher Retirement System and Montana Public Employee Retirement System are facing—complete with independent third-party actuarial analysis and expert technical assistance— is crucial to ensuring the state’s financial solvency in the long term. The Pension Integrity Project at Reason Foundation stands ready to help guide Montana policymakers and stakeholders in addressing the shifting fiscal landscape.
Makeup of Montana TRS Contributions
Montana law (MCA 19-20- 608 & 609) dictates that if the TRS funded ratio is below 90%, employer contributions should contribute an additional 1% of compensation, increasing by 0.1% each year up to 2% or the TRS funding ratio is above 90%.

The supplemental rate applicable to the university system (MUS-RP), is currently set at 4.72%.
What Drives Montana TRS Pension Debt?
- Deviations from Investment Return Assumptions have been the largest contributor to the TRS unfunded liability, adding $897 million since 2002.
- Changes to Actuarial Methods & Assumptions to better reflect current market and demographic trends have exposed over $400 million in previously unrecognized unfunded liability.
- Deviations from Demographic Assumptions including deviations from withdrawal, retirement, disability, and mortality assumptions — added$332 million to the unfunded liability over the last 15 years.
- Extended Amortization Timetables have resulted in interest on TRS debt exceeding the actual debt payments (negative amortization) since 2002, adding a net $39 million in the unfunded liabilities.
Challenge 1: Assumed Rate of Return
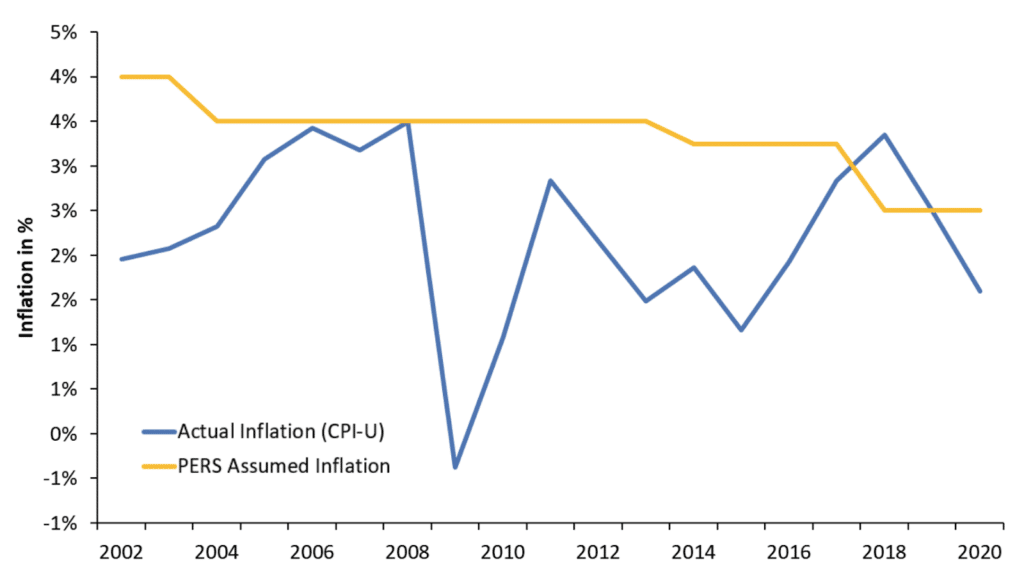
Investment Return History, 2001- 2020
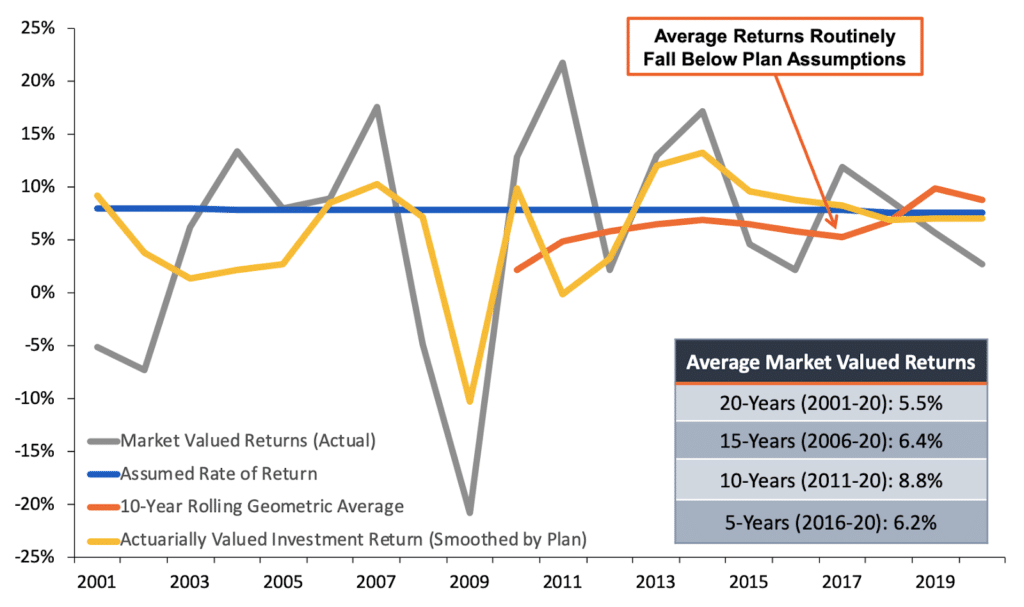
Investment Returns Have Underperformed
TRS actuaries have historically used an 8% assumed rate of return to calculate member and employer contributions, slowly lowering the rate to 7.5% over the past two decades in response to significant market changes.
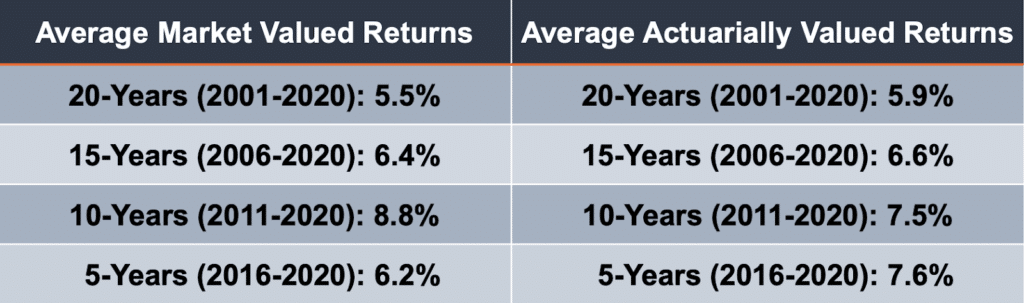
Average long-term portfolio returns have not matched long-term assumptions over different periods of time:
Note: Past performance is not the best measure of future performance, but it does help provide some context to the challenge created by having an excessively high assumed rate of return.
New Normal: Markets Have Recovered Since the Crisis—TRS Funded Ratio Has Not
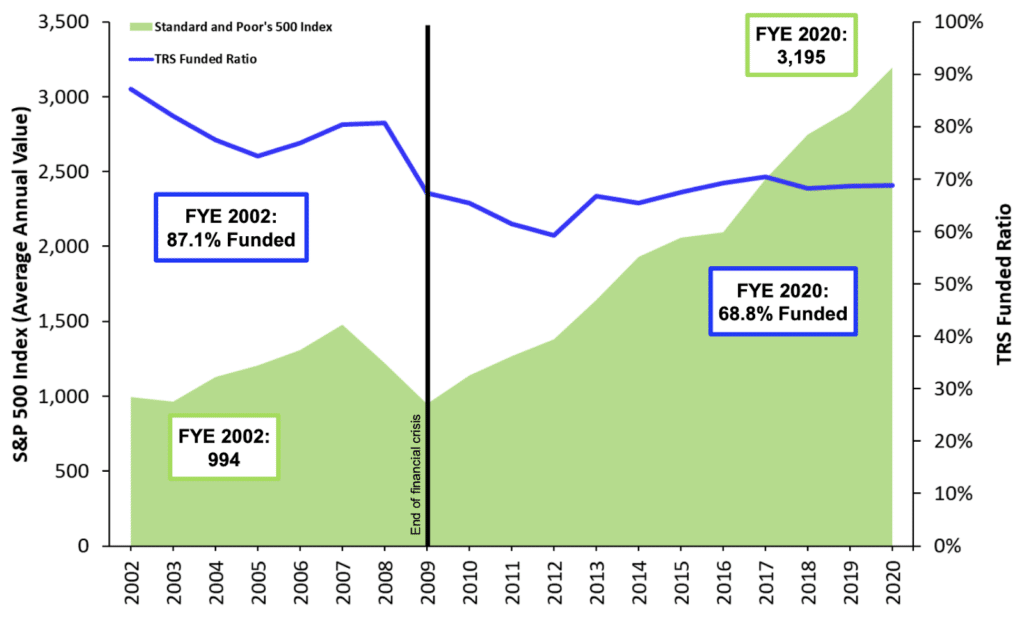
The “new normal” for institutional investing suggests that achieving even a 6% average rate of return in the future is optimistic.
- Over the past two decades there has been a steady change in the nature of institutional investment returns.
- 30-year Treasury yields have fallen from near 8% in the 1990s to consistently less than 3%.
- New phenomenon: negative interest rates, designates a collapse in global bond yields.
- The U.S. just experienced the longest economic recovery in history, yet average growth rates in GDP and inflation are below expectations.
- McKinsey & Co. forecast the returns on equities will be 20% to 50% lower over the next two decades compared to the previous three decades.
- Using their forecasts, the best-case scenario for a 70/30 portfolio of equities and bonds is likely to earn around 5% return.
- 3. The Montana TRS 5-year average return is around 6.6%, well below the assumed 7.5% return assumption.
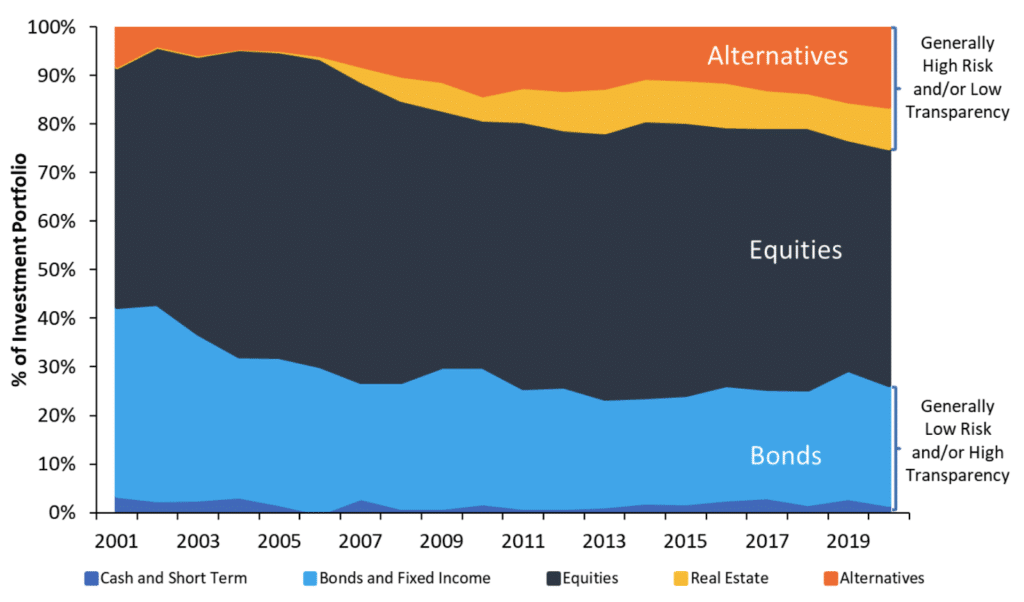
Expanding Risk in Search for Yield
Probability Analysis: Measuring the Likelihood of TRS Achieving Various Rates of Return
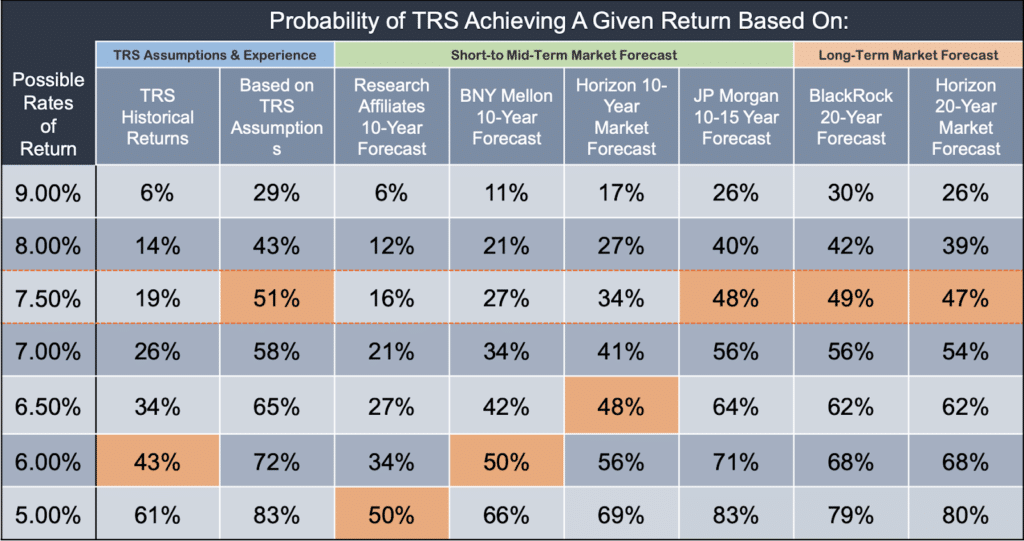
Probability Analysis: Measuring the Likelihood of TRS Achieving Various Rates of Return
TRS Assumptions & Experience
- A probability analysis of TRS historical returns over the past 20 years (2000-2020) indicates only a modest chance (26%) of hitting the plan’s 7.5% assumed return.
- Horizon’s long-term capital assumptions adopted by TRS project a 47% chance of achieving their current investment return target.
Short-Term Market Forecast
- Returns over the short to medium term can have significant negative effects on funding outcomes for mature pension plans with large negative cash flows like TRS.
- Analysis of capital market assumptions publicly reported by the leading financial firms (BlackRock, JP Morgan, BNY Mellon, and Research Affiliates) suggests that over a 10-15 year period, TRS returns are likely to fall short of their assumption.
Long-Term Market Forecast
- Longer-term projections typically assume TRS investment returns will revert back to historical averages.
- The “reversion to mean” assumption should be viewed with caution given historical changes in interest rates and a variety of other market conditions that increase uncertainty over longer projection periods, relative to shorter ones.
- Forecasts showing long-term returns near 7.5% being likely also show a significant chance that the actual longterm average return will fall far shorter than expected.
- For example, according to the BlackRock’s 20-year forecast, while the probability of achieving an average return of 7.5% or higher is about 49%, the probability of earning a rate of return below 5% is about 21%.
Important Funding Concepts
Employer Contribution Rates
- Statutory Contributions: TRS employers make annual payments based on a rate set in Montana state statute, meaning contributions remain static until changed by legislation.
- Actuarially Determined Employer Contribution (ADEC): Unlike statutory contributions, ADEC is the annual required amount TRS’s consulting actuary has determined is needed to be contributed each year to avoid growth in pension UAL and keep TRS solvent.
- Variable Contribution Rate: Not as rigid as statutory contributions but not as responsive as actuarially determined contributions, Montana’s current tradition of legislating contribution increases only after years of poor performance requires political action in times of volatility, with rate increases requested only when forecasts show that the period to fully amortize the current legacy unfunded liability exceeds 30 years.
All-In Employer Cost
- The true cost of a pension is not only in the annual contributions, but also in whatever unfunded liabilities remain. The ”All-in Employer Cost” combines the total amount paid in employer contributions and adds what unfunded liabilities remain at the end of the forecasting window.
Quick Note: With actuarial experiences of public pension plans varying from one year to the next, and potential rounding and methodological differences between actuaries, projected values shown onwards are not meant for budget planning purposes. For trend and policy discussions only.
Baseline Rates
- The variable contribution rate used as the baseline funding policy in the following analysis responds to changes in market conditions in lieu of the slower-paced statutory rate increases anticipated under current state law.
- The variable baseline rate factors in statutorily required appropriation from the state of a fixed amount of $25 million for the fiscal year beginning July 1, 2013 which is used to calculate the amortization period and subsequent variable rate. The variable baseline rate does not include conditional decreases tied to the TRS funding period.
Risk Management
Stress Testing TRS Using Crisis Simulations
Stress on the Economy:
- Market watchers expect dwindling consumption and incomes to severely impact near-term tax collections – applying more pressure on state and local budgets.
- Revenue declines are likely to undermine employers’ ability to make full pension contributions, especially for those relying on more volatile tax sources (e.g., sales taxes) and those with low rainyday fund balances.
- Many experts expect continued market volatility, and the Federal Reserve is expected to keep interest rates near 0% for years and only increase rates in response to longer-term inflation trends.
Methodology:
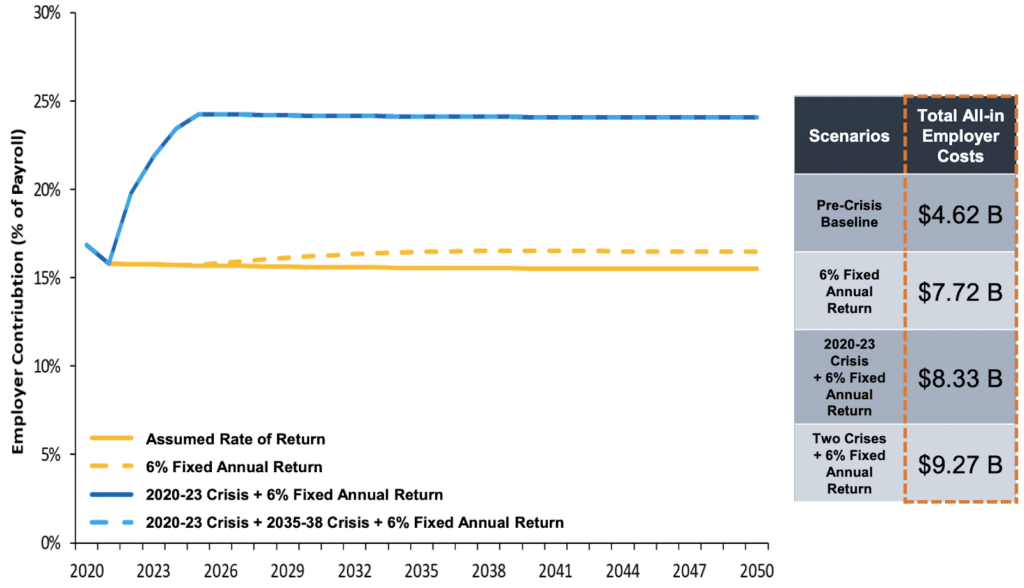
- Adapting the Dodd-Frank stress testing methodology for banks and Moody’s Investors Service recession preparedness analysis, the following scenarios assume one year of -24.0% returns in 2020, followed by three years of 11% average returns.
- Recognizing expert consensus regarding a diminishing capital market outlook, scenarios assume a 6% fixed annual return between crisis scenarios.
- Given the increased exposure to volatile global markets and rising frequency of Black Swan economic events, we include a scenario incorporating a second Black Swan crisis event in 2035.
Scenario Comparison of Employer Costs
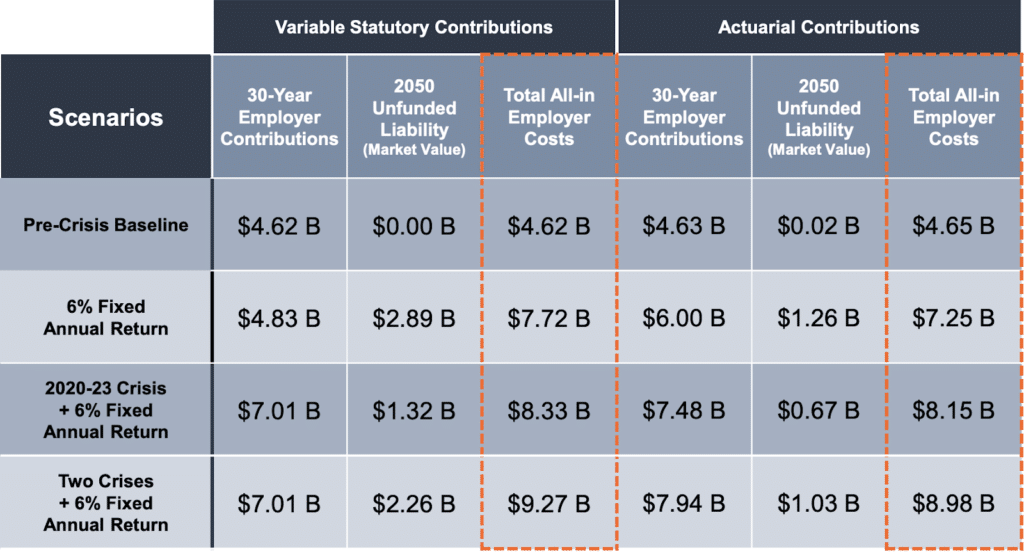
How a Crisis Increases TRS Cost
- Discount Rate: 7.5%
- Assumed Return: 7.5%
- Actual Return: Varying
- Amo. Period: Current
Unfunded Liabilities Under Crisis Scenarios
- Discount Rate: 7.5%
- Assumed Return: 7.5%
- Actual Return: Varying
- Amo. Period: Current

TRS Solvency Under Crisis Scenarios
- Discount Rate: 7.5%
- Assumed Return: 7.5%
- Actual Return: Varying
- Amo. Period: Current

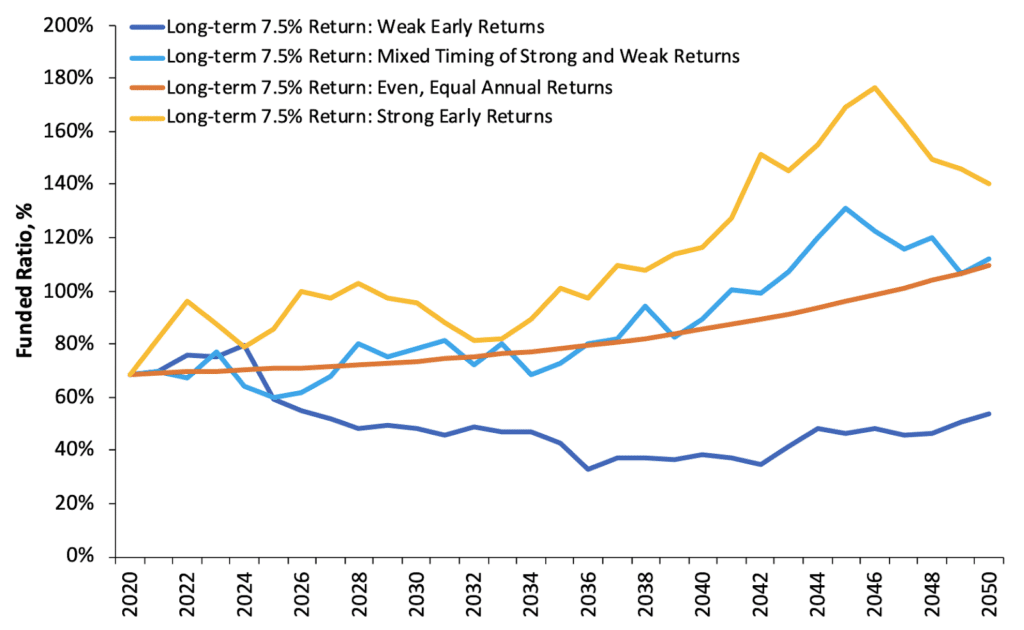
All Paths to a 7.5% Average Return Are Not Equal
Long-Term Average Returns of 7.5%
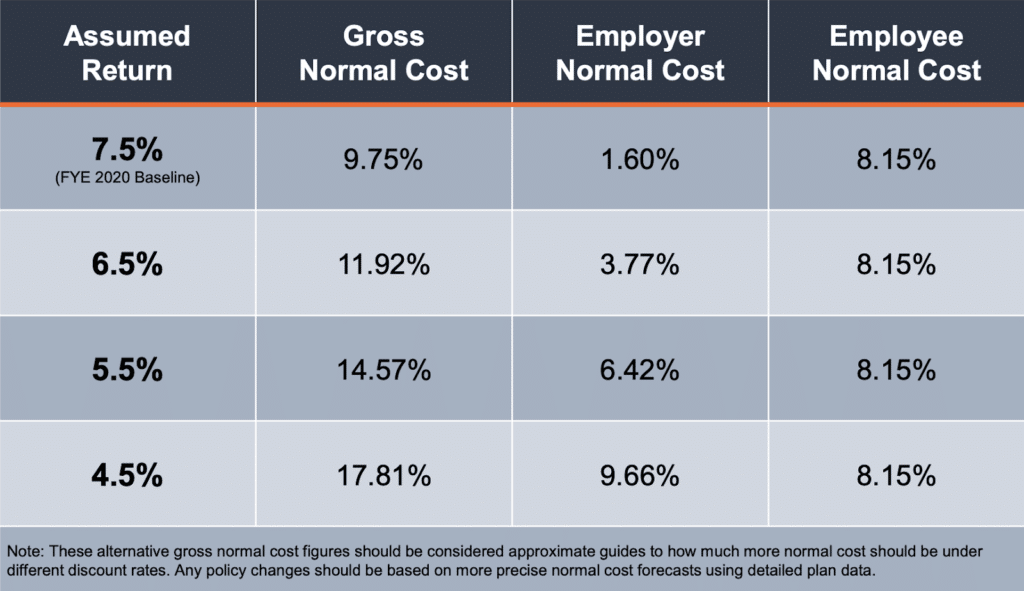
Sensitivity Analysis: Normal Cost Comparison Under Alternative Assumed Rates of Return
Amounts to be Paid in 2020-21 Contribution Fiscal Year, % of projected payroll
Challenge 2: Deviations and Changes to Actuarial Assumptions and Methods
Failure to meet actuarial assumptions, and delay in updating those assumptions, has led to an underestimation of the total pension liability.
Adopting more prudent actuarial assumptions and methods necessitates the recognition of additional unfunded liabilities.
↘️ Actuarial Assumption and Methods
TRS unfunded liabilities have increased by a combined $400 million between 2002-2020 due to prudent updates to actuarial assumptions and methods such as lowering the assumed rate of return.
↗️ Salary Increase Assumptions
TRS employers have not raised salaries as fast as expected, resulting in lower payrolls and thus lower earned pension benefits – a common case for many state-level pension plans. This reduced unfunded liabilities by $266 million from 2002-2020.
↘️ Withdrawal Rate, Service Retirement, and Mortality Assumptions
Due to misaligned demographic assumptions, TRS unfunded liabilities have increased by a combined $332 million between 2002-2020.
This likely stems from a combination of one or more of the following factors:
✅ Actual withdrawal rates before members have reached either a reduced or normal retirement threshold have been lower than anticipated.
✅ TRS members have been retiring earlier than expected, receiving more pension checks.
↘️ Overestimated Payroll Growth
Overestimating payroll growth may create a long-term problem for TRS in combination with the level-percentage of payroll amortization method used by the plans.
This method backloads pension debt payments by assuming that future payrolls will be larger than today (a reasonable assumption).
While in and of itself, a growing payroll is a reasonable assumption, if payroll does not grow as fast as assumed, employer contributions must rise as a percentage of payroll.
✅ This means the amortization method combined with the inaccurate assumption is delaying debt payments.


Challenge 3: Insufficient Contributions & Debt Management Policies
Over the past two decades employer contributions to TRS have fallen short of the amount plan actuaries determined would be needed to reach 100% funding in 30 years.
State contributions towards paying off pension debt are less than the interest accruing on the pension debt.
Challenge 4: Discount Rate and Undervaluing Debt
The discount rate undervalues the total amount of existing pension obligations.
1. The “discount rate” for a public pension plan should reflect the risk inherent in the pension plan’s liabilities:
- Most public sector pension plans — including Montana TRS — use the assumed rate of return and discount rate interchangeably, even though each serve a different purpose.
- The Assumed Rate of Return (ARR) adopted by Montana TRS estimates what the plan will return on average in the long run and is used to calculate contributions needed each year to fund the plans.
- The Discount Rate (DR), on the other hand, is used to determine the net present value of all of the already promised pension benefits and supposed to reflect the risk of the plan sponsor not being able to pay the promised pensions.
2. Setting a discount rate too high will lead to undervaluing the amount of pension benefits actually promised:
- If a pension plan is choosing to target a high rate of return with its portfolio of assets, and that high assumed return is then used to calculate/discount the value of existing promised benefits, the result will likely be that the actuarially recognized amount of accrued liabilities is undervalued.
3. It is reasonable to conclude that there is almost no risk that Montana would pay out less than 100% of promised retirement income benefits to members and retirees.
- The Contract Clause in the Montana Constitution is similar to the U.S. Constitution’s Contract Clause. There is little basis to conclude Montana TRS has the kind of liability risks implied by a high discount rate.
4. The discount rate used to account for this minimal risk should be appropriately low.
- The higher the discount rate used by a pension plan, the higher the implied assumption of risk for the pension obligations.
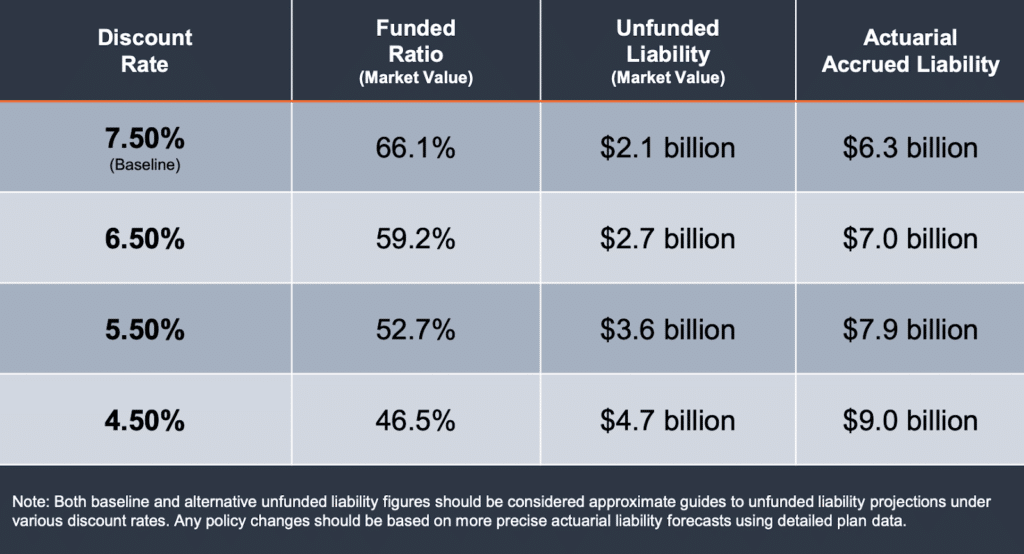
Sensitivity Analysis: Pension Debt Comparison Under Alternative Discount Rates
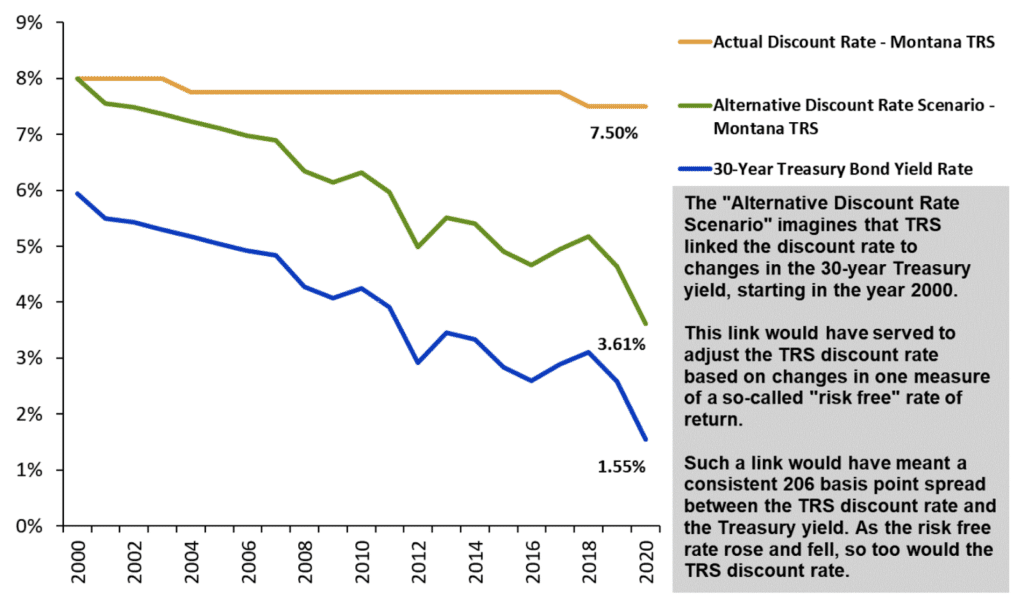
Changes in the Risk Free Rate Compared to TRS Discount Rate (2000-2020)
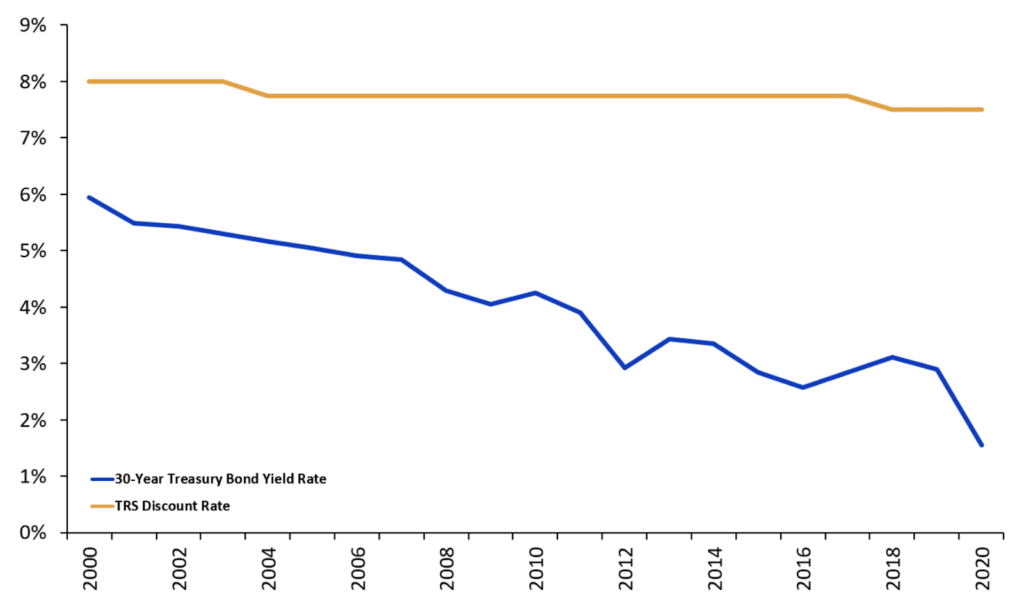
Change in the Risk Free Rate Compared to TRS Discount Rate (2000-2020)
Challenge 5: The Existing Benefit Design Does Not Work for Everyone
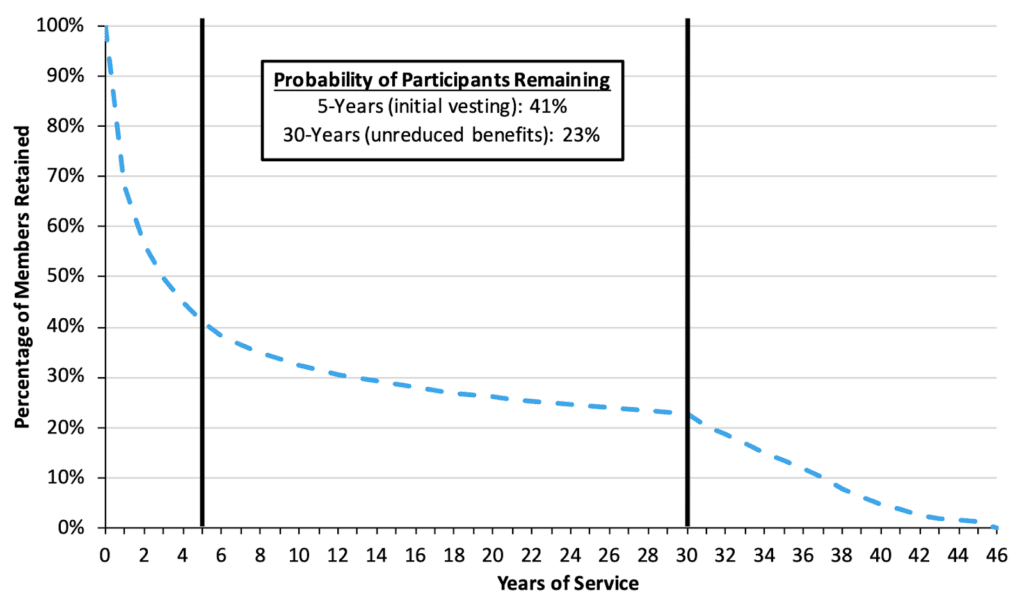
- More than 70% of TRS members do not work long enough to earn a full pension
- The turnover rate for Montana teachers suggests that the current retirement benefit design is not effective at encouraging retention in the near-term, and may be pushing out employees at the end of their careers.
- 59% of new teachers leave before 5 years
- TRS members need to work for 5 years before their benefits become vested.
- Another 9% of new teachers who are still working after 5 years will leave before 10 years of service
- 23% of all members hired will still be working after 30 years, long enough to qualify for full, unreduced pension benefits
Recruiting a 21st Century Workforce:
- There is little evidence that retirement plans—DB, DC, or other design—are a major factor in whether an individual wants to enter public employment.
- The most likely incentive to increase recruiting to the public workforce is increased salary.
Retaining Employees:
- If worker retention is a goal of the TRS system, it is clearly not working, as nearly 70% of employees leave within 5 years.
- After 15 to 25 years of service there is some retention effect, but the same incentives serve to push out workers in a sharp drop off after 30 years of service or reaching the “Rule of 80” threshold.
A Framework for Policy Reform
Objectives
- Keeping Promises: Ensure the ability to pay 100% of the benefits earned and accrued by active workers and retirees
- Retirement Security: Provide retirement security for all current and future employees
- Predictability: Stabilize contribution rates for the long-term
- Risk Reduction: Reduce pension system exposure to financial risk and market volatility
- Affordability: Reduce long-term costs for employers/taxpayers and employees
- Attractive Benefits: Ensure the ability to recruit 21st Century employees
- Good Governance: Adopt best practices for board organization, investment management, and financial reporting
Pension Resiliency Strategies
- Establish a plan to pay off the unfunded liability as quickly as possible. The Society of Actuaries Blue Ribbon Panel recommends amortization schedules be no longer than 15 to 20 years.
- Adopt better funding policy, risk assessment, and actuarial assumptions. These changes should aim at minimizing risk and contribution rate volatility for employers and employees.
- Create a path to retirement security for all participants. Consider offering members that won’t accrue a full pension benefit access to other plan design options (e.g., cash balance, DC, hybrid, etc.)
Potential Solutions
1. Establish a Plan to Pay Off the Unfunded Liability as Quickly as Possible
Current amortization policy for TRS targets time horizons that are too long:
- TRS targets a 30-year window to pay off unfunded liabilities.
- The longer the unfunded liability amortization period, the greater chance that market risk drives unfunded liabilities higher.
- The Society of Actuaries Blue Ribbon Panel recommends amortization schedules be no longer than 15 to 20 years.
Rethink amortization in two steps:
Step 1: Address the Current Unfunded Liability
- Segmenting accrued unfunded liabilities from any gains or losses in future years can allow policymakers to set the past debt on a direct and fiscally realistic course to being fully funded.
- Prevents the need to revisit the issue in subsequent sessions.
Step 2: Develop a Plan to Tackle Future Debt
- Adopting “layered” amortization for future unfunded liabilities. would ensure that any new pension debt accrued in a given year is paid off much faster—preferably 10 years or less—than the current 30+ year period.
- Covering future pension losses with consistent annual payments over a decade or less would align TRS amortization policy with actuarial best practice.
2. Adopt Better Funding Policy, Investment Policy, Risk Assessments and Actuarial Assumptions
Current funding policy has created negative amortization and exposes the plan to significant risk of additional unfunded liabilities.
- Establishing TRS contribution rates in statute, and requiring political intervention with uncertain outcomes, makes it difficult in practice to respond quickly to changing economic circumstances.
- This policy is in contrast with the more common funding method based on normal cost and the amortization cost that pays down unfunded liabilities over a predetermined, closed period.
- Given the volatility of their amortization policy, it will likely take more than 30 years to amortize current unfunded liabilities, exposing TRS to major financial risks over that period.
- Options to consider include:
- Requiring employers and future employees that accrue defined benefits to make contributions on a pre-defined cost sharing basis (such as a 50-50 split) as actuarially determined
- Using short (10-year or less) periods to pay off any new, annual unfunded liabilities that might accrue
Improve risk assessment and actuarial assumptions.
- Look to lower the assumed return such that it aligns with more realistic probability of success.
- Adjust the portfolio to reduce high risk assets no longer needed with lower assumed return target.
- Work to reduce fees and costs of active management.
- Consider adopting an even more conservative assumption for a new hire defined benefit plan.
- Require regular stress testing for contribution rates, funded ratios, and cash flows with look-forward forecasts for a range of scenarios.
- While pension plans can, and some do, implement a limited risk assessment under current financial reporting, an independent risk assessment/stress test review using a range of pre-built stress scenarios is the ideal approach.
3. Create a Path to Retirement Security for All Participants of TRS
Montana TRS is not providing a path to retirement income security for all educators
- For example, only 23% of teachers make it to the 30 years necessary for a full, unreduced pension. This means the majority of teachers could be better served by having the choice of an alternative, more portable plan design—such as a cash balance, hybrid or defined contribution retirement plan.
Employees should have options when selecting a retirement plan design that fits their career and lifestyle goals
- Cash balance plans can be designed to provide a steady accrual rate, offer portability, and ensure a path to retirement security.
- Montana has a long history of managing cash balance plans through municipality, county, and district systems.
- Defined contribution plans can be designed to auto-enroll members into professionally managed accounts with low fees that target specified retirement income and offer access to annuities.
Montana Teacher Retirement System (TRS) Pension Solvency Analysis