


- 19th Annual Highway Report (.pdf)
- High Resolution Figures and Charts (.pdf)
- Complete Tables for 19th Annual Highway Report (Excel)
We often hear the nation’s infrastructure is crumbling, but state highway conditions are the best they’ve been in 19 years, according to Reason Foundation’s 19th Annual Highway Report. Unfortunately, the recession is partly responsible for the improvement in road conditions: people are driving less which has helped slow pavement deterioration and reduced traffic congestion and fatalities.
The annual Reason Foundation study measures the condition and cost-effectiveness of state-owned roads in 11 categories, including deficient bridges, urban traffic congestion, fatality rates, pavement condition on urban and rural Interstates and on major rural roads, and the number of unsafe narrow rural lanes. National performance in all of those key areas improved in 2008, the most recent year with complete data available.
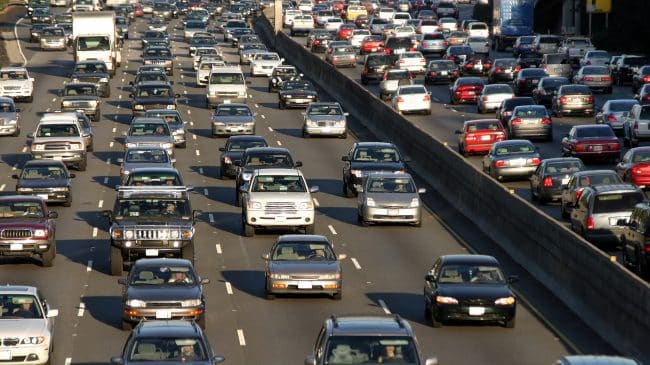
Drivers in California, Minnesota, Maryland, Michigan and Connecticut are stuck in the worst traffic. Over 65 percent of all urban Interstates are congested in each of those five states. But nationally, the percentage of urban Interstates that are congested fell below 50 percent for the first time since 2000, when congestion standards were revised.
Motorists in California and Hawaii have to look out for the most potholes on urban Interstates. In those two states, 25 percent of urban interstate pavement is in poor condition. Alaska and Rhode Island have the bumpiest rural pavement, each with about 10 percent in poor condition. However, nationally, pavement conditions on urban Interstates are the best they’ve been since 1993, and rural primary roads are the smoothest they’ve been since 1993 also.
Rhode Island has the most troubled bridges in the country, with over 53 percent of bridges deficient. For comparison, just 10 percent of top-ranked Nevada’s bridges are rated deficient. Across the country, over 141,000 (23.7 percent) of America’s bridges were structurally deficient or functionally obsolete in 2008, the lowest percentage since 1984.
With the recession reducing driving, and engineering improving road design and car safety features, traffic fatalities have steadily fallen to the lowest levels since the 1960s. Massachusetts has the safest roads with just 0.67 fatalities per 100 million miles driven. Montana and Louisiana have the highest fatality rates, at 2.12 and 2.02 fatalities per million miles driven.
Overall, North Dakota, Montana and Kansas have the most cost-effective state highway systems. Rhode Island, Alaska, California, Hawaii and New York have the least cost-effective roads. The full Annual Highway Report rankings are:
1. North Dakota
2. Montana
3. Kansas
4. New Mexico
5. Nebraska
6. South Carolina
7. Wyoming
8. Missouri
9. Georgia
10. Oregon
11. Delaware
12. South Dakota
13. Texas
14. Kentucky
15. Nevada
16. Mississippi
17. Idaho
18. Virginia
19. Tennessee
20. Alabama
21. North Carolina
22. Utah
23. Indiana
24. Ohio
25. Minnesota
26. Arizona
27. New Hampshire
28. Wisconsin
29. Arkansas
30. West Virginia
31. Iowa
32. Maine
33. Washington
34. Colorado
35. Michigan
36. Louisiana
37. Oklahoma
38. Pennsylvania
39. Florida
40. Illinois
41. Connecticut
42. Vermont
43. Maryland
44. Massachusetts
45. New Jersey
46. New York
47. Hawaii
48. California
49. Alaska
50. Rhode Island
Over the last two years New Jersey has moved up from last to 45th in the overall rankings, but still spends dramatically more than every other state. New Jersey spends $1.1 million per mile on state roads. The second biggest spender, Florida, spends $671,000 per mile and California spends $545,000 per mile. South Carolina had the lowest expenses, spending just $34,000 per mile.
California also squanders a massive amount of transportation money that never makes it onto roads, spending $93,464 in administrative costs for every mile of state road. New York ($89,194 per mile), Massachusetts ($71,982), and New Jersey ($62,748) also compare poorly to states like Texas ($6,529) and Virginia ($6,370) that spend dramatically less on administrative costs.
“We’re seeing several factors combine to produce significant improvement in highway conditions,” said David T. Hartgen, author of the report and emeritus professor of transportation studies at the University of North Carolina at Charlotte. “Over the last several years, states invested a lot more money to improve pavement and bridges. Spending increased 8 percent from 2007 to 2008, and per-mile spending on state roads has almost tripled since 1984, so you’d hope and expect to see improved performance. As pavement gets better, roads are widened and bridges get repaired, you’d also expect safety to improve. And the significant reduction in vehicle miles traveled during the recession has also played a role in slowing system decay. But as the states run short of money and deal with large budget deficits, we’ll see if this progress can be continued.”
Detailed Results for Each State
Previous Editions of the Annual Highway Report
18th Annual Highway Report by David T. Hartgen
17th Annual Highway Report by David T. Hartgen