

Oregon introduced the first gas tax in 1919 and within a decade each state adopted the motor fuel tax as a method of funding roads. Gas taxes used to fund roads and highways represent the users-pay/users-benefit principle of responsible taxation, whereby those bearing the cost of the tax—highway users—obtain the benefits of a well-maintained road network.
Many states today, however, divert portions of their state gas tax revenue to the state general fund and other non-highway uses, such as these:
- The largest and most common diversions, found in 20 states, are those to transit and active transportation (pedestrian and bicycle projects). New York and New Jersey, for example, allocate over a third of their respective motor fuel tax (MFT) revenue to transit.
- Ten states divert a portion of their gas tax revenue to law enforcement and safety services, marking the second most common diversion.
- Though less frequent, diversions to education tend to be substantial, accounting for 25.9% and 24.7% of gas tax revenue in Michigan and Texas respectively.
- Other states divert gas tax revenue to tourism, environmental programs and administrative costs. In total, 22 states divert over 1% of their gas tax revenue.
By violating the users-pay/users-benefit principle, diversion poses both immediate and long-term threats to transportation funding. Diversions can leave roads and highways underfunded.
The 10 states diverting the largest percentage of their gas tax money: New York diverts 37.5% of its gas tax revenue, Rhode Island diverts 37.1%, New Jersey and Michigan divert 33.9%, Maryland diverts 32.5%, Connecticut diverts 27%, Texas diverts 24%, Massachusetts diverts 23.9%, Florida diverts 13.6% and Vermont diverts 13.2%.
This policy brief catalogs state gas tax diversions of the 25 states that employ that practice and outlines potential policies that will strengthen the users-pay/users-benefit model of transportation funding.
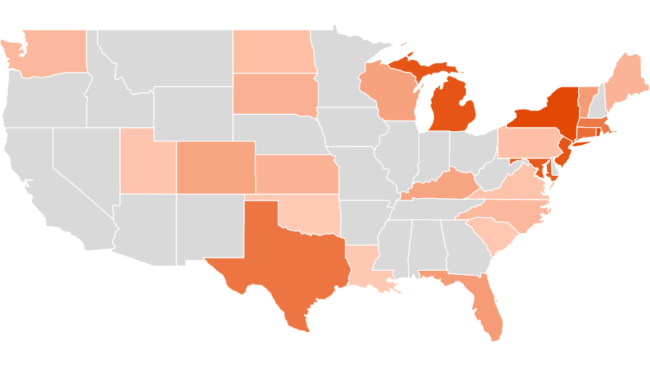
State Gas Tax Diversion Rates
Background
On February 25, 1919, Oregon introduced the first gas tax in the United States at a rate of one cent per gallon. The use of gas taxes to fairly fund roads and highways proliferated across the country, as gas usage correlated with vehicle road usage. Within the following decade, each of the then-48 states had adopted its own gas tax.
In 1932, Congress created the first federal gas tax revenue source (one cent) intended to decrease the federal deficit; road and highway funding was traditionally under the purview of states and local governments. The federal gas tax rate was raised by half-a-cent per gallon during World War II and by another half-cent during the Korean War to generate new revenue for national defense.
With the Federal Aid Highway Act of 1956, commonly referred to as the Interstate Highways Act, Congress raised the federal gas tax rate from two cents to three cents and dedicated all of the revenue to the newly created Highway Trust Fund (HTF). The HTF was designed to fund the construction of the new Interstate Highway System utilizing the users-pay/users-benefit principle of taxation.
The users-pay/users-benefit principle simply means that those paying a user tax receive the benefits, connecting a government expenditure with both market demands and a reliable, fair source of revenue. In the case of the gas tax, drivers are proportionally paying for their road and highway use, assuming the revenue is allocated for roads and highways. Overall, government revenue that conforms to the users-pay/users-benefit principle is fair, proportional, predictable and self-limiting, while serving as a signal for investment.
Over the past 100 years, state gas tax rates have increased to accommodate the need to build (and rebuild) highways and to account for inflation. In July of 2019 alone, for example, drivers in 14 states saw gas tax rate increases. A few states, such as Rhode Island and Georgia, mandate periodic indexing of the gas tax rate to account for inflation. New Jersey, on the other hand, ties its gas tax rate to revenue goals.
Figure 1 provides a representative sample of state gas tax rates between 2000 and 2019.
Figure 1: State Gas Tax Rates 2000-2019
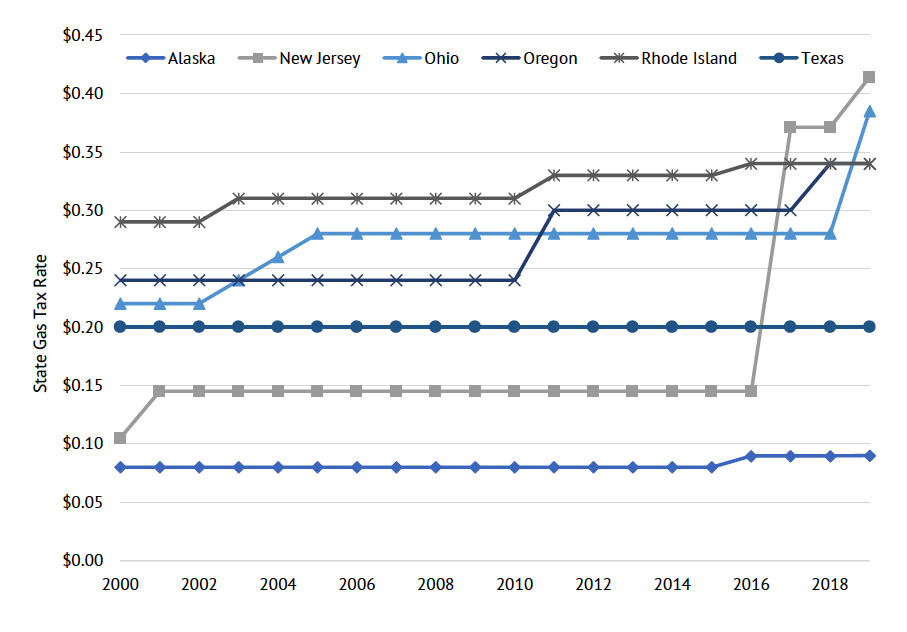
Source: “State Motor Fuels Tax Rates: 2000 to 2019.”
Today, a driver in Oregon, who would have paid one cent per gallon in 1919, pays 36.8 cents per gallon in state gas tax and 18.4 cents per gallon in federal gas tax. A penny in 1919 is equivalent to 15 cents in 2020, for the same purchasing power. Today’s vehicles are roughly 17.6% more fuel-efficient than those in the 1920s, though vehicles today are roughly 66.9% more fuel-efficient compared to vehicles in 1960 (when comparing the average fuel economy of 24.7 miles per gallon today, with the fuel economy of the Ford Model T at 21 miles per gallon and average fuel economy of 14.8 miles per gallon in 1960). Based solely on inflation and increased fuel efficiency, that one-cent tax in 1919 would equal 17.6 cents today. Currently, state gas taxes range from 14.32 cents per gallon in Alaska to 62.05 cents per gallon in California, not including the 18.4 cents per gallon federal gas tax.
Rather than dedicating all gas tax revenue to roads and highways, many states divert portions of the revenue to non-road and non-transportation purposes. While those paying gas taxes may see some benefit in non-road and non-transportation spending, these diversions undermine the users-pay/users-benefit principle and promote irresponsible spending behavior. When gas tax revenue is treated as an undedicated stream of governmental revenue, roads suffer, and tax dollars may be wasted on ineffective or irrelevant programs.
Though this brief focuses specifically on the diversion of state-level gas tax revenue, it should be noted that each state funds its road system with a unique combination of fees and taxes, often including motor vehicle registration fees and various sales taxes. Accordingly, a state may divert its registration fees while using all of its gas tax revenue on roads and highways.
A gas tax diversion rate is only one measure of a state’s fiscal responsibility. California, as an example, diverts none of its gas tax revenue. Yet, the state collects over $8 billion in revenue per year from vehicle registration and miscellaneous motor vehicle fees, which is partially allocated to programs such as the California Highway Patrol, the California High-Speed Rail Authority and local public transportation.
Despite the aforementioned limitations, this brief solely examines the diversion of state-level motor fuel tax revenue as a measure of fiscal responsibility for state transportation funding.
Gas Tax Diversions by State
Gas tax diversions vary by state for the 25 states that employ that practice. Figure 2 lists state gas tax diversion rates, or the percentage of state gas tax revenue that is allocated for expenses unrelated to road construction or maintenance. Figure 3 provides a regional diversion percentage. The remainder of this section itemizes all diversions of state level gas taxes. Explanations for each state’s diversion rate can be found in this brief’s appendix.
Figure 2: State Gas Tax Diversion Rates
Source: State Annual Budget, Transportation Budget and Transportation Fund Statements Data; more detail provided in this brief’s appendix.Figure 3: Average Diversion Rate of Each U.S. Region

Methodology
Although the definition, collection, and allocation of gas tax revenue vary widely in each state, this brief uses the following methodology.
Gas taxes can generally be broken down into two components: a gasoline excise tax and additional fees, both of which are charged at per-gallon rates. Most often, a vast majority of the gas tax rate is composed of a per-gallon excise tax, which is the common label for a gas tax. Additional per-gallon fees are often used to cover the costs of petroleum-tank inspections or specifically designated funds, be they agricultural, environmental, or transportation-related.
In other states, the label of excise tax merely reflects one, a usually older but indistinguishable, component of the gas tax. In the case of New Jersey, the traditional gasoline excise tax is only $0.105 per gallon, while the other fees total $0.309 per gallon. Yet, both components are collected as one coherent gas tax.
Other states, such as Florida, break down their gas taxes into multiple components. Each component, roughly corresponding to legislation, increases the overall gas tax rate, and is governed by its own set of revenue allocation formulas.
Also, to be consistent, this brief uses the term “motor fuel tax” (MFT) revenue to refer to the combination of revenue from per-gallon gasoline taxes, diesel taxes, special fuel taxes, and, in some cases, jet and aviation fuel taxes. Each state reports its MFT revenue differently. Some states collect MFT revenue from road-based and non-road vehicles (boats, trains or planes) separately. In such cases, the exact amount of revenue associated with each transport mode is known, and the allocation process occurs separately. Others collect all per-gallon MFT revenue together and distribute non-highway MFT revenue according to a preapproved formula. In other words, all fuel is subjected to the MFT, and revenue for each transportation mode is allocated at some proportion.
Generally, this brief uses road-based MFT revenue unless there is no way to separate how much revenue was collected from non-road MFTs. For the latter states, any allocation of non-highway MFT revenue to non-highway uses is not considered a diversion.
To calculate the diversion rate, we first examine which state account or fund MFT revenue is allocated to in each state. States such as Georgia and Illinois have dedicated accounts for MFT revenue, which means all expenditures from the government account or fund is from MFT revenue. Other states such as Alabama or Massachusetts, place MFT revenue into a special transportation account, or, as Alaska does, into a general fund account with various other sources of revenue.
When MFT revenue is placed into an account with other sources of revenue, this brief assumes that MFT revenue is distributed proportionally among all expenditures from the account, unless those expenditures have a dedicated source of revenue or state statute mandates further regulations on MFT revenue within a given account.
Most states allocate small portions of their MFT revenue to cover the administrative costs of MFT collection or to provide refunds for agricultural or recreation-based fuel use, neither of which is considered a diversion.
In terms of calculating its gas tax diversion rate, each of the 25 states generally conforms to the outline above while having its own unique circumstances, be they special expenses due to geography, such as ferries in Alaska and Washington, or a particularly complicated allocation formula such as the one used in Florida.
Colorado
| MFT Revenue (FY17-18) | $647,230,168 | |
| Colorado State Patrol | $71,958,000 | 11.1% |
| Total Diversions | $71,958,000 | 11.1% |
Connecticut
| MFT Revenue (FY19) | $807,800,000 | |
| CDOT Rail Operations | $102,790,177 | 12.7% |
| CDOT Bus Operations | $91,765,964 | 11.4% |
| ADA Paratransit | $20,529,944 | 2.5% |
| Depart. of Energy and Environmental Protection | $1,374,589 | 0.2% |
| Temporary Assistance for Needy Families | $1,164,398 | 0.1% |
| Non-ADA Paratransit | $282,874 | 0.0% |
| Transfer to Port Authority | $196,440 | 0.0% |
| Total Diversions | $218,104,386 | 27.0% |
Florida
| MFT Revenue (FY18-19) | $2,843,316,758 | |
| Dedicated to Mass Transit | $343,917,548 | 12.1% |
| Fish and Wildlife Conservation Commission | $15,900,000 | 0.6% |
| Agriculture Emergency Eradication Trust Fund | $13,656,350 | 0.5% |
| Aquatic Weed Control | $6,300,000 | 0.2% |
| Refunds, Municipal, County and School Districts | $5,477,000 | 0.2% |
| Refunds, City Transit | $677,000 | 0.0% |
| Total Diversions | $385,927,898 | 13.6% |
Kansas
| MFT Revenue (FY19) | $459,158,000 | ||
| Highway Patrol | $10,287,479 | 2.2% | |
| Education | $8,728,425 | 1.9% | |
| Transit | $6,730,758 | 1.5% | |
| Debt Services for Statehouse | Renovations | $3,523,022 | 0.8% |
| Mental Health Grants | $1,920,350 | 0.4% | |
| Total Diversions | $31,190,034 | 6.8% | |
Kentucky
| MFT Revenue (FY18) | $764,900,000 | |
| State Police Operations | $39,670,400 | 5.2% |
| Sec. of State General Admin. | $37,773,507 | 4.9% |
| Kentucky Vehicle Enforcement | $5,159,530 | 0.7% |
| Office of Admin. Serv., Finance Postal Services | $226,739 | 0.0% |
| Kentucky Artisan Center at Berea | $225,271 | 0.0% |
| Energy Recovery Road Fund | $154,266 | 0.0% |
| Governor’s Office of Homeland Security | $136,822 | 0.0% |
| Total Diversions | $83,346,535 | 10.9% |
Louisiana
| MFT Revenue (FY18) | $601,840,910 | |
| Mass Transit Program | $3,726,160 | 0.6% |
| Total Diversions | $3,726,160 | 0.6% |
Maine
| MFT Revenue (FY18) | $259,278,445 | |
| Department of Public Safety | $16,945,476 | 6.5% |
| Implementation of REAL ID | $191,526 | 0.1% |
| Dept. of Environmental Protection | $18,411 | 0.0% |
| Total Diversions | $17,155,413 | 6.6% |
Maryland
| MFT Revenue (FY18) | $1,126,049,284 | |
| MTA Bus Operations | $85,781,687 | 7.6% |
| WMATA Operating | $75,979,270 | 6.7% |
| MTA Rail Operations | $41,752,242 | 3.7% |
| MTA Facilities & Capital Equipment | $35,030,321 | 3.1% |
| WMATA Capital | $32,431,776 | 2.9% |
| Port Administration | $19,077,968 | 1.7% |
| MTA Transit Administration | $18,150,257 | 1.6% |
| MTA Statewide Programs Operations* | $14,183,043 | 1.3% |
| Chesapeake Bay 2010 Trust Fund | $12,936,000 | 1.2% |
| MD State Police—Commercial Vehicles | $12,281,687 | 1.1% |
| Office of Transportation Tech Services | $9,516,626 | 0.8% |
| MD State Police—Auto Safety | $3,731,617 | 0.3% |
| Waterway Improvement Fund | $2,812,000 | 0.2% |
| MTA Major Technology Projects | $753,792 | 0.1% |
| Information Tech Development Projects | $703,505 | 0.1% |
| MD Department of Environment | $229,990 | 0.0% |
| Total Diversions | $365,351,781 | 32.5% |
Massachusetts
| MFT Revenue (FY20) | $846,700,000 | |
| Non-Road or Highway Transportation | $122,184,800 | 14.4% |
| Massachusetts Bay Transportation Authority | $44,958,000 | 5.3% |
| Regional Transit Authorities | $32,037,000 | 3.8% |
| Motor Vehicle Insurance Merit Rating Board | $3,599,546 | 0.4% |
| Total Diversions | $202,779,346 | 23.9% |
Michigan
| MFT Revenue (FY18) | $2,268,300,000 | |
| School Aid Fund | $587,939,300 | 25.9% |
| Comprehensive Transportation Fund | $167,650,132 | 7.4% |
| MDOT Local Agency Programs, Rail | $14,860,456 | 0.7% |
| Total Diversions | $770,449,888 | 33.9% |
New Jersey (FY18)
| MFT Revenue (FY18) | $1,062,400,000 | |
| NJ Transit, Rail Infrastructure Needs | $106,731,000 | 10.0% |
| NJ Transit, Bus and Lightrail Investment | $89,208,000 | 8.4% |
| NJ Transit, Rail Rolling Stock Improvement | $57,879,000 | 5.5% |
| NJ Transit, Other Expenses | $54,593,000 | 5.1% |
| NJ Transit, Rail Improvement | $24,957,000 | 2.3% |
| NJ Transit, Northern Branch Extension | $15,399,000 | 1.5% |
| NJ Transit, Technology Improvements | $4,779,000 | 0.5% |
| NJ Transit, Safety Improvements | $3,186,000 | 0.3% |
| NJ Transit, Additional Lightrail expansions | $2,124,000 | 0.2% |
| Municipal Aid—Transit Village Grants | $531,000 | 0.0% |
| Municipal Aid—Bikeway Grants | $531,000 | 0.0% |
| Municipal Aid—Safe Streets to Transit | $531,000 | 0.0% |
| Total Diversions | $360,449,000 | 33.9% |
New York
| MFT Revenue (FY18) | $1,600,000,000 | |
| Dedicated Mass Transit Funds | $600,000,000 | 37.5% |
| (MTA Funding) | ($494,000,000) | (30.9%) |
| Total Diversions | $600,000,000 | 37.5% |
North Carolina
| MFT Revenue (FY18) | $1,993,032,340 | |
| Powell Bill (pedestrian and bike projects) | $59,792,000 | 3.0% |
| Roadside Environment Projects | $40,400,000 | 2.0% |
| Durham MPO, Transportation Alternatives (TA) | $3,391,875 | 0.2% |
| Various City-level Bike and Pedestrian Projects | $847,500 | 0.0% |
| Greater Hickory MPO, TA | $618,750 | 0.0% |
| Winston-Salem MPO, TA | $513,375 | 0.0% |
| National Recreational Trails | $450,000 | 0.0% |
| Statewide Bicycle & Pedestrian Programs | $375,000 | 0.0% |
| State Rail Preliminary Engineering | $375,000 | 0.0% |
| French Broad River MPO, TA | $321,750 | 0.0% |
| Fonta Flora Trail | $234,750 | 0.0% |
| Bent Creek Greenway, Multi-Use Paths | $150,000 | 0.0% |
| Fayetteville MPO, TA | $147,750 | 0.0% |
| Belk Greenway Connector | $51,750 | 0.0% |
| Greensboro MPO, TA | $9,750 | 0.0% |
| Total Diversions | $107,679,250 | 5.4% |
North Dakota
| MFT Revenue (FY17-19) | $370,300,000 | |
| Public Transportation | $5,380,344 | 1.5% |
| Highway Patrol | $4,719,600 | 1.3% |
| Transfer to the Ethanol Subsidy Fund | $3,124,800 | 0.9% |
| Total Diversions | $13,224,744 | 3.6% |
Oklahoma
| MFT Revenue (FY18) | $485,375,960 | |
| ODOT, Public Transit | $977,130 | 0.2% |
| ODOT, Passenger Rail | $723,330 | 0.2% |
| Total Diversions | $1,700,460 | 0.4% |
Pennsylvania
| MFT Revenue (FY18) | $1,855,800,000 | |
| Multimodal Transportation Fund | $35,000,000 | 1.9% |
| Additional Unrestricted Motor License Fund | $22,000,000 | 1.2% |
| Total Diversions | $57,000,000 | 3.1% |
Rhode Island
| MFT Revenue (FY18) | $156,131,387 | |
| Rhode Island Public Transit Agency | $43,560,657 | 27.9% |
| Department of Human Services | $4,527,810 | 2.9% |
| Traffic Safety Capital Program | $3,996,200 | 2.6% |
| Transportation Alternatives | $2,743,400 | 1.8% |
| RIDOT, Headquarter Operations | $2,315,650 | 1.5% |
| RIDOT, Transit Operations | $855,500 | 0.5% |
| Total Diversions | $57,999,217 | 37.1% |
South Carolina
| MFT Revenue (FY18-19) | $808,000,000 | |
| Intermodal Planning & Mass Transit | $7,289,000 | 0.9% |
| Total Diversions | $7,289,000 | 0.9% |
South Dakota
| MFT Revenue (FY18) | $208,980,515 | |
| Public Safety | $13,574,322 | 6.5% |
| Loan to the State Rail Fund | $2,011,057 | 1.0% |
| Total Diversions | $15,585,379 | 7.5% |
Texas
| MFT Revenue (FY18) | $3,674,996,627 | |
| Transfer to the School Fund | $899,837,878 | 24.7% |
| Total Diversions | $899,837,878 | 24.7% |
Utah
| MFT Revenue (FY18) | $488,893,653 | |
| Public Safety | $5,495,500 | 1.1% |
| County and City-Level BRT Road Projects | $2,400,000 | 0.5% |
| Sidewalk Safety | $500,000 | 0.1% |
| Office of Tourism | $118,000 | 0.0% |
| Total Diversions | $8,513,500 | 1.7% |
Vermont
| MFT Revenue (FY18) | $108,568,381 | |
| Non-AOT State Police | $7,026,750 | 6.5% |
| Vermont Rail Transit | $2,840,249 | 2.6% |
| Public Transit | $2,760,454 | 2.5% |
| Information Centers | $1,348,522 | 1.2% |
| Bike & Pedestrian Programs | $291,429 | 0.2% |
| Park & Ride Facilities | $72,870 | 0.1% |
| Total Diversions | $14,340,274 | 13.2% |
Virginia
| MFT Revenue (FY18) | $898,700,000 | |
| Support to Other State Agencies | $16,881,195 | 1.9% |
| Dept. of Rail and Public Transportation | $868,626 | 0.1% |
| Total Diversions | $17,749,821 | 2.0% |
Washington
| MFT Revenue (FY17-19) | $3,605,000,000 | |
| Fish Barrier Removal Projects | $37,500,000 | 1.0% |
| Regional Mobility Grants (park+ride, buses) | $25,000,000 | 0.7% |
| Special Needs Transit Grants | $25,000,000 | 0.7% |
| Sidewalk Program | $16,000,000 | 0.4% |
| Complete Streets Program | $14,670,000 | 0.4% |
| Transit Related Grants (park+ride, buses) | $13,880,000 | 0.4% |
| Rural Mobility Grants | $13,750,000 | 0.4% |
| Pedestrian and Bike Projects | $11,130,000 | 0.3% |
| LED Street Light Retrofit Program | $10,000,000 | 0.3% |
| Pedestrian and Bike Safety Projects | $9,380,000 | 0.3% |
| Safe Routes to School Grants | $7,000,000 | 0.2% |
| Commute Trip Reduction Programs | $5,130,000 | 0.1% |
| Vanpool Investments | $3,880,000 | 0.1% |
| Transfer to Small City Sidewalk Program | $2,000,000 | 0.0% |
| Total Diversions | $194,320,000 | 5.4% |
Wisconsin
| MFT Revenue (FY17-18) | $1,065,937,000 | |
| Transit Aid | $60,149,700 | 5.6% |
| Aeronautics Aid | $57,891,900 | 5.4% |
| Harbor Aid | $5,777,000 | 0.5% |
| Total Diversions | $123,076,600 | 11.5% |
Before analyzing the above list of diversions, it is important to acknowledge some context. Primarily, this list represents conservative estimates of gas tax diversions as it is difficult to separate administrative expenses and debt services between roads and transit.
Connecticut, for example, allocates 40% of its gas tax revenue, equivalent to $610 million, toward debt services for transportation-related bonds. While this list does not count debt servicing as a diversion, almost a quarter of all transportation bond revenue in FY2019 supported transit. Accordingly, it is possible that Connecticut uses a portion of gas tax revenue to fund transit-related bonding that has little to do with roads or highways.
Additionally, some states allow local governments to divert portions of gas tax revenue. Colorado shares gas tax revenue with local jurisdictions and allows cities and counties to spend up to 15% of their share on transit and 5% on administration. Therefore, the diversion rate for Colorado underestimates the actual amount of gas tax revenue that is diverted.
Finally, each state is unique, and the diversion rate may not necessarily reflect a state’s fiscal responsibility or lack thereof.
California’s lack of diversions appears impressive when compared to other large states. All motor fuel tax revenue in California was placed into the Motor Vehicle Fuel Account of the Transportation Tax Fund, which is used solely on roads and highways. However, California diverts revenue from other driver charges, such as registration and license fees, to law enforcement and rail transportation. Therefore, California still spends revenue generated from automobiles on non-roadway purposes.
Analysis
There are clear patterns in where diverted gas tax revenue is allocated. The most common diversion is for non-road and non-highway transportation, such as trains, buses and pedestrian projects. The following 20 states all divert gas tax revenue to non-roadway transportation projects: Connecticut, Florida, Kansas, Louisiana, Maryland, Massachusetts, Michigan, New Jersey, New York, North Carolina, North Dakota, Oklahoma, Pennsylvania, Rhode Island, South Carolina, Utah, Vermont, Virginia, Washington and Wisconsin.
The second most common diversion is for law enforcement, mainly state police, which occurs in nine states: Colorado, Kansas, Kentucky, Maine, Maryland, North Dakota, South Dakota, Utah and Vermont. Similar to the diversions toward transit, the diversions for law enforcement are tangentially related to highways but violate the users-pay/users-benefit principle. Not all drivers use roads that are under the purview of state police, nor do all drivers see a proportional benefit to their road use because of the state police.
Diversions to state environmental agencies and protection programs are fairly common as well. Florida diverts revenue toward its Fish and Wildlife Conservation Commission and its aquatic weed control program. Maine diverts revenue directly to its respective Departments of Environmental Protection. Maryland diverts to its Chesapeake Bay Trust Fund and Washington toward its fish barrier removal program. Michigan and Texas divert large portions of their gas tax revenue to education at 25.9% and 24.7% respectively.
Beyond those aforementioned diversions, both Utah and Vermont divert small portions of their revenue toward tourism promotion, while Rhode Island diverts revenue to its Department of Human Services (DHS), an agency that cares for veterans, the elderly, and those who are unable to take care of themselves. Motor fuel tax revenue is supposed to offset some of the transportation costs incurred at DHS, whether it’s refunding any gas tax paid by its government vehicles or funding paratransit programs. Similarly, Kansas uses MFT revenue to fund mental health grants for the Department of Aging and Disability Services.
Geographically, the only major pattern is that the dense liberal states of the Northeast tend to have high diversion rates. The average diversion rate in the Northeast is 20.3%, well above the 5.7%, 5.2%, and 1.4% average diversion rates in the South, Midwest and West respectively.
New York diverts 37.5% of its gas tax revenue, Rhode Island diverts 37.1%, New Jersey diverts 33.9%, Maryland diverts 32.5%, Connecticut diverts 27.0%, Massachusetts diverts 23.9% and Vermont diverts 13.2%. Diversions to mass transit make up almost all of the diversions in each of the aforementioned states except Vermont. Maine’s diversion rate of 6.6% may be low compared to its neighbors but is still higher than 34 other states.
Unsurprisingly, New York, Rhode Island, and New Jersey not only have the three highest diversions rates but also rank at the bottom (45th, 48th and 50th) respectively on the overall value for money ranking in Reason’s Annual Highway Report. Large diversions are common in northeast states, and drivers suffer where road quality is worse and costs higher than nationwide.
At the same time, Delaware and New Hampshire divert none of their respective revenue, and Pennsylvania diverts only 3.1% of its revenue despite having a fairly robust public transportation system in Philadelphia (although Pennsylvania does divert Turnpike revenue to transit systems).
Of the 10 states with the highest diversion rates, only Michigan at 33.4%, Texas at 24.7% and Florida at 13.6% are located outside the Northeast. Michigan and Texas use gas tax revenue to help fund education, while Florida diverts to mass transit and environmental programs.
Ironically, these diversions could actually harm the departments to which they are allocated in the long term. As electric cars become more common and gasoline-powered vehicles more efficient, gas tax revenue is expected to decline. Texas’ School Fund received $900 million in funding from gas tax revenue in the fiscal year 2019 alone, leaving education in Texas vulnerable to declining revenue.
While high diversion rates are located mainly in the Northeast, low diversion rates are found throughout the country in a great variety of states. Ohio, with its large population, diverts less than 1% of its revenue, as do the less-populated Alaska and Hawaii. Liberal Oregon and conservative Wyoming divert none of their respective gas tax revenue, nor do snowy Minnesota or sunny New Mexico.
Recommendations
Gas tax diversions are a product of public policy, not ideology, climate, or demographics. Accordingly, there are steps that any state can take to decrease its diversion rate while acknowledging its own unique public policy needs.
States could enact legislation or constitutional amendments that prevent diversions of gas tax revenue in the first place. Georgia’s constitution, for example, restricts the use of motor fuel tax revenue to roads and bridges for construction, maintenance, and financing. The most effective route, as demonstrated by Georgia, is to deposit all gas tax revenue into its own account and restrict the use of that account to roads and highways. States can also pursue legislation or a constitutional amendment to designate gas tax revenue as dedicated revenue regardless of what account the revenue is deposited in.
States should create restrictions on gas tax revenue that meet the needs of their state without allowing for diversions to tangentially related projects. Alaska, Indiana, and Iowa all treat MFT revenue as dedicated and place a restriction on its use. South Dakota allocates gas tax revenue toward radio communications, but that infrastructure is needed for driver’s safety in the rural state. On the other hand, Utah restricts gas tax revenue but diverts revenue to facilitate Bus Rapid Transit on roads and highways.
Alabama has particularly robust laws that outline what gas tax revenue may be used at the state, county, and municipal levels. For example, local governments can use their share of gas tax revenue to fund plant removal as a part of road maintenance, but they may not use gas tax revenue to purchase herbicide.
States with programs that depend on diverted revenue may find the outright elimination of diversions to be politically infeasible. Such states could mandate a 10% annual decrease in their diversion rate and require that roads and highways meet certain quality thresholds before any revenue is diverted.
New Jersey, which allocates roughly $360 million in MFT revenue to NJ Transit per year, would have the more manageable task of raising $36 million in new transit-related revenue each year, possibly through a value-added tax placed on real estate within a mile of an NJ Transit train station or directly on an express bus route. Additionally, NJ Transit could reevaluate the necessity of unprofitable routes.
Similarly, Texas, a state where just under $900 million of MFT revenue is allocated to education, would have to decrease its diversion by $90 million per year. Texas would likely have to audit its education spending, a positive process in the long-term while finding more appropriate, reliable sources of revenue.
Over the course of a decade, these states would completely transition away from diversions, benefiting roads and highways while preparing transit and schools for the projected decline in MFT revenue.
In the long term, as electric vehicles become the norm and gas tax revenue declines, states could use dedicated mileage-based user fees (MBUFs) to equitably fund highways. MBUFs would replace state gas taxes and distribute the exact costs of highways onto those who use highways, eliminating the problem of diverted revenue.