


Executive Summary
Claims of victory from the Obama administration aside, federal debts and deficits remain a serious problem. In 2015, the annual deficit reached a low of 2.5% of GDP, which is much worse than previous cyclical troughs achieved in 2000 and 2007. Even more troublesome, the Congressional Budget Office projects that deficits will steadily increase in the coming decades as Baby Boomers continue to retire and health care costs rise. The major party presidential candidates have not offered meaningful proposals to address this issue, as they focus on personal attacks, immigration, trade and other matters. Libertarian Gary Johnson appears to have the best overall approach to the deficit, but even his policies need to be more completely fleshed out.
.
Written by: Marc Joffe
Project Director: Anthony Randazzo
Part 1: The Deficit Problem and Its Causes
Introduction
U.S. federal government debt as a percentage of Gross Domestic Product (GDP) is at its highest level since World War II. Unless significant changes are made to entitlement programs, which together with other “mandatory” spending represent 68% of the federal budget, it is likely to increase in coming decades. The Congressional Budget Office (CBO) projects that within 30 years, interest on the debt alone will account for over 20% of the federal budget.[1]
Evidence suggests that high levels of government debt can reduce economic growth. Given the pernicious nature of this problem, one might imagine that it would be a major issue for presidential candidates. Yet it is receiving less attention from the public and from major party presidential candidates during this cycle than it did in 2012. Before the 2012 election, 12% of respondents told Gallup that the federal budget was the nation’s most pressing problem. By May 2016, that number had declined to 3%. Hillary Clinton doesn’t even have a page addressing the deficit on her website, while Donald Trump’s site contains a video that only discusses the nation’s debt in a very general way. This brief seeks to outline the scale of the problem of debt and deficits tied to federal spending and describe the approach to the problem taken by the various presidential candidates.
1.1 The Federal Deficit is Growing as a Percentage of GDP
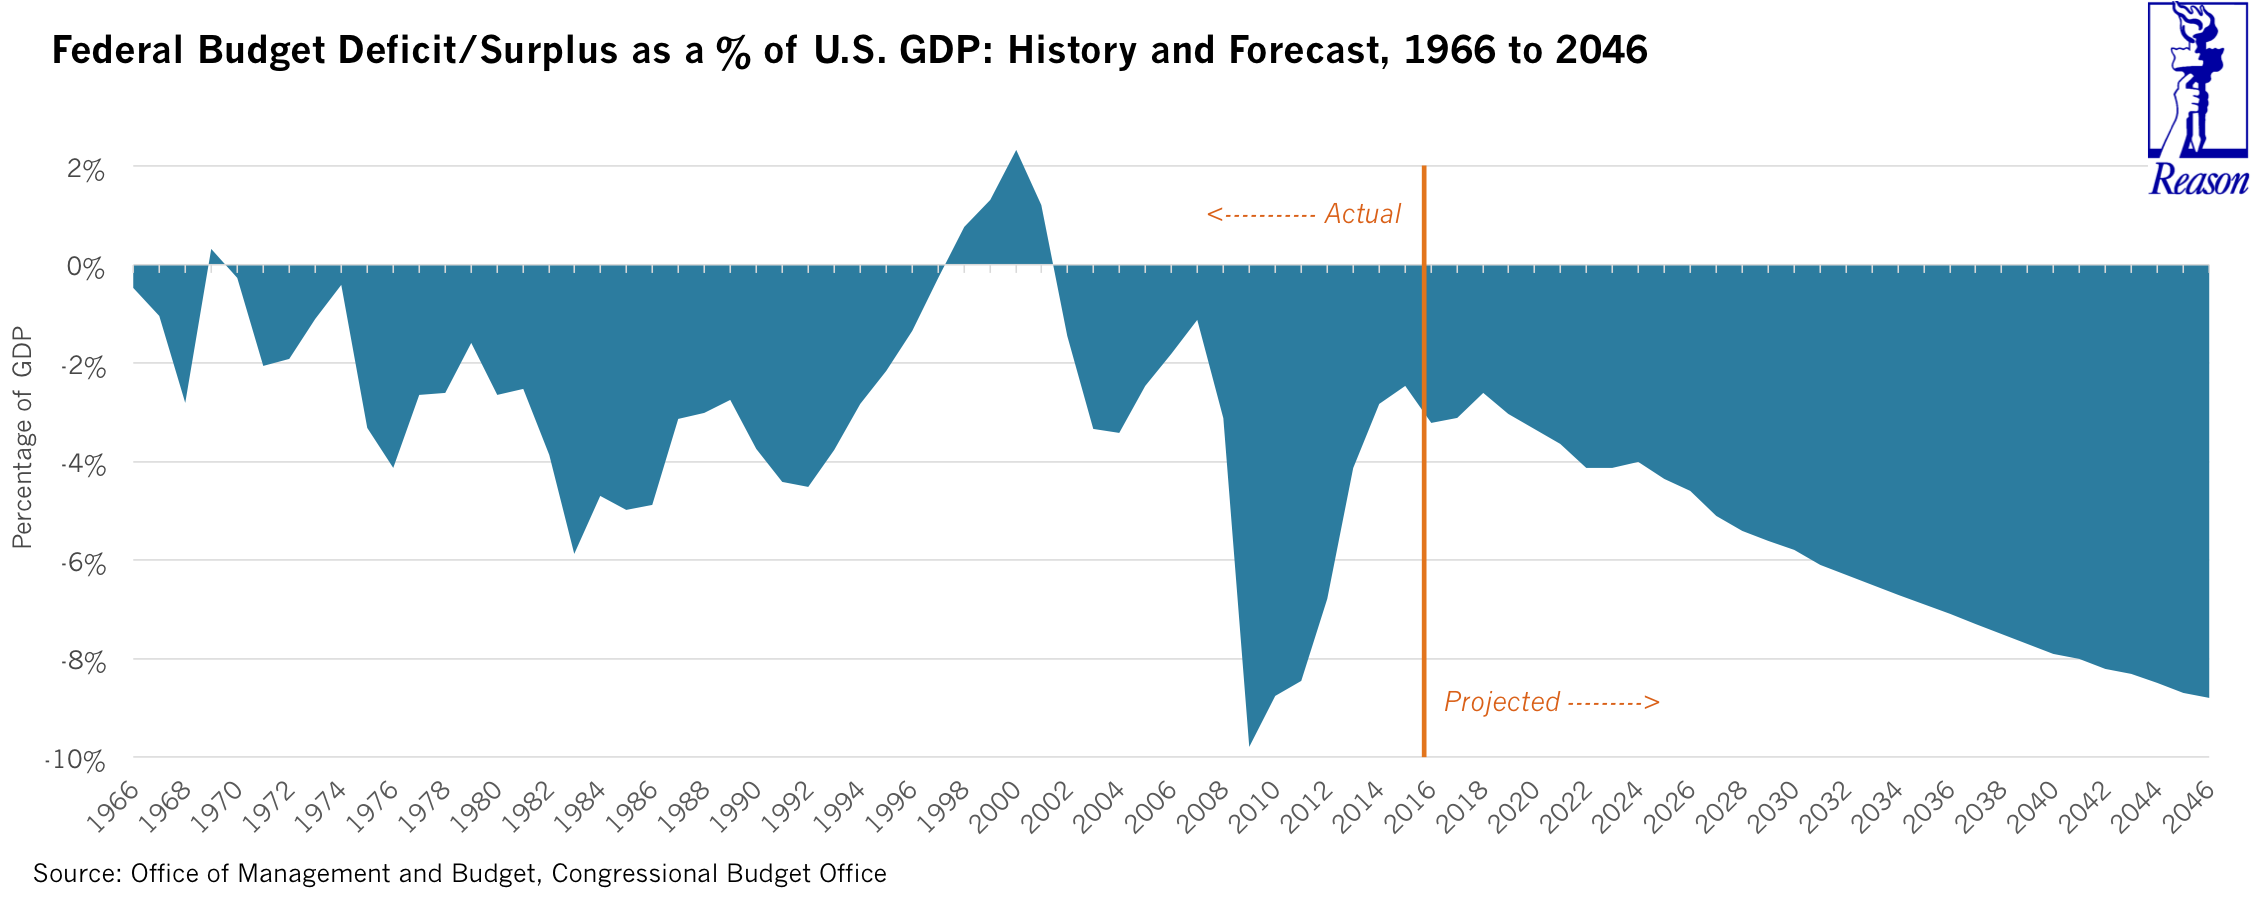
The U.S. Treasury Department reports that the federal deficit for fiscal year 2016, which ended on September 30, was $587 billion, or 3.2% of GDP. Since this level compares quite favorably to the $1,413 billion (9.8% of GDP) deficit recorded at the beginning of the Obama administration in 2009, some have claimed that there is no need for concern.
But looking at deficit trends across business cycles, the picture becomes considerably darker. Deficits tend to peak during a recession and then fall as the economy grows, reaching a trough several years after the end of the recession. The most recent cyclical trough occurred in 2015, with a deficit of $438 billion, or 2.5% of GDP. This is considerably worse than the cyclical troughs in 2007, when the deficit was 1.1% of GDP, and 2000, when there was a surplus of 2.3% of GDP. The CBO expects year’s deficit to be higher than that of 2015, suggesting that the U.S. is entering a phase of rising deficits once again.
The dismal picture painted by the CBO’s forecast is shown in Figure 1. Note that without any substantive fiscal policy change the CBO estimates the deficit will continue to expand as a percentage of GDP.
Figure 1:
1.2 How Federal Spending Breaks Down
A large part of the problem of U.S. federal deficit and debt is caused by the fact that much of the federal budget is either on auto-pilot or considered sacrosanct by one of the two major parties. Three currently politically untouchable categories—Social Security, Medicare and interest on the debt—account for 47.7% of this year’s budget. In 10 years, the CBO expects these three items to take up 58.7% of federal spending.
Using a wider measure of “off-limits” spending categories, we can reach much higher proportions of spending immune to conventional budget cutting. The CBO divides federal spending into two broad categories: mandatory and discretionary.
To get a sense of the scope of how concentrated federal spending is on these off-limits categories, Figure 2 visually breaks out the percentage of total spending represented by different policy priorities.
Mandatory spending consists of all categories that are not part of the appropriation process. These types of spending continue in the absence of a budget, following pre-specified formulas unless Congress and the president change them. Aside from Medicare, Social Security and interest on the debt, mandatory spending includes unemployment insurance, earned income tax credits and Medicaid. Although some Republicans might wish to cut these programs, they enjoy widespread Democratic support.
The opposite is true of the largest category of discretionary spending: the defense budget. This comprises 51.8% of discretionary spending and 15.1% of all federal spending. Republicans generally oppose major reductions to the defense budget. A closely related and even more sacrosanct spending category is veterans’ programs, some of which are mandatory and some of which are discretionary.
Mandatory, defense and veterans spending accounts for 86.2% of this year’s budget. The CBO expects that proportion to rise to 90.4% in 2026. Within the relatively small sliver of discretionary spending that remains are many popular programs that would also be hard to cut. The space program, for example, which costs $18.8 billion, or about 0.5% of all federal spending.
Figure 2:
1.3 Baby Boomer Retirements Mean Increasing Federal Expenses
From a demographic standpoint, federal finances are heavily impacted by the aging of the Baby Boomers. This is the generation born between 1946 and 1964, a period during which birth rates were especially high. In 2000, when the federal surplus peaked, most Boomers were in or near their peak earning years, paying relatively high marginal tax rates and generally not drawing government benefits. By 2015, many Boomers were eligible for Medicare and collecting Social Security checks.
The Baby Boomer retirement trend will continue through the next decade, and is expected to worsen the federal fiscal balance. In 2031, the last Boomers will reach 67, the age of eligibility for full social security benefits. By then, the CBO expects the annual deficit to reach 6.1% of GDP.
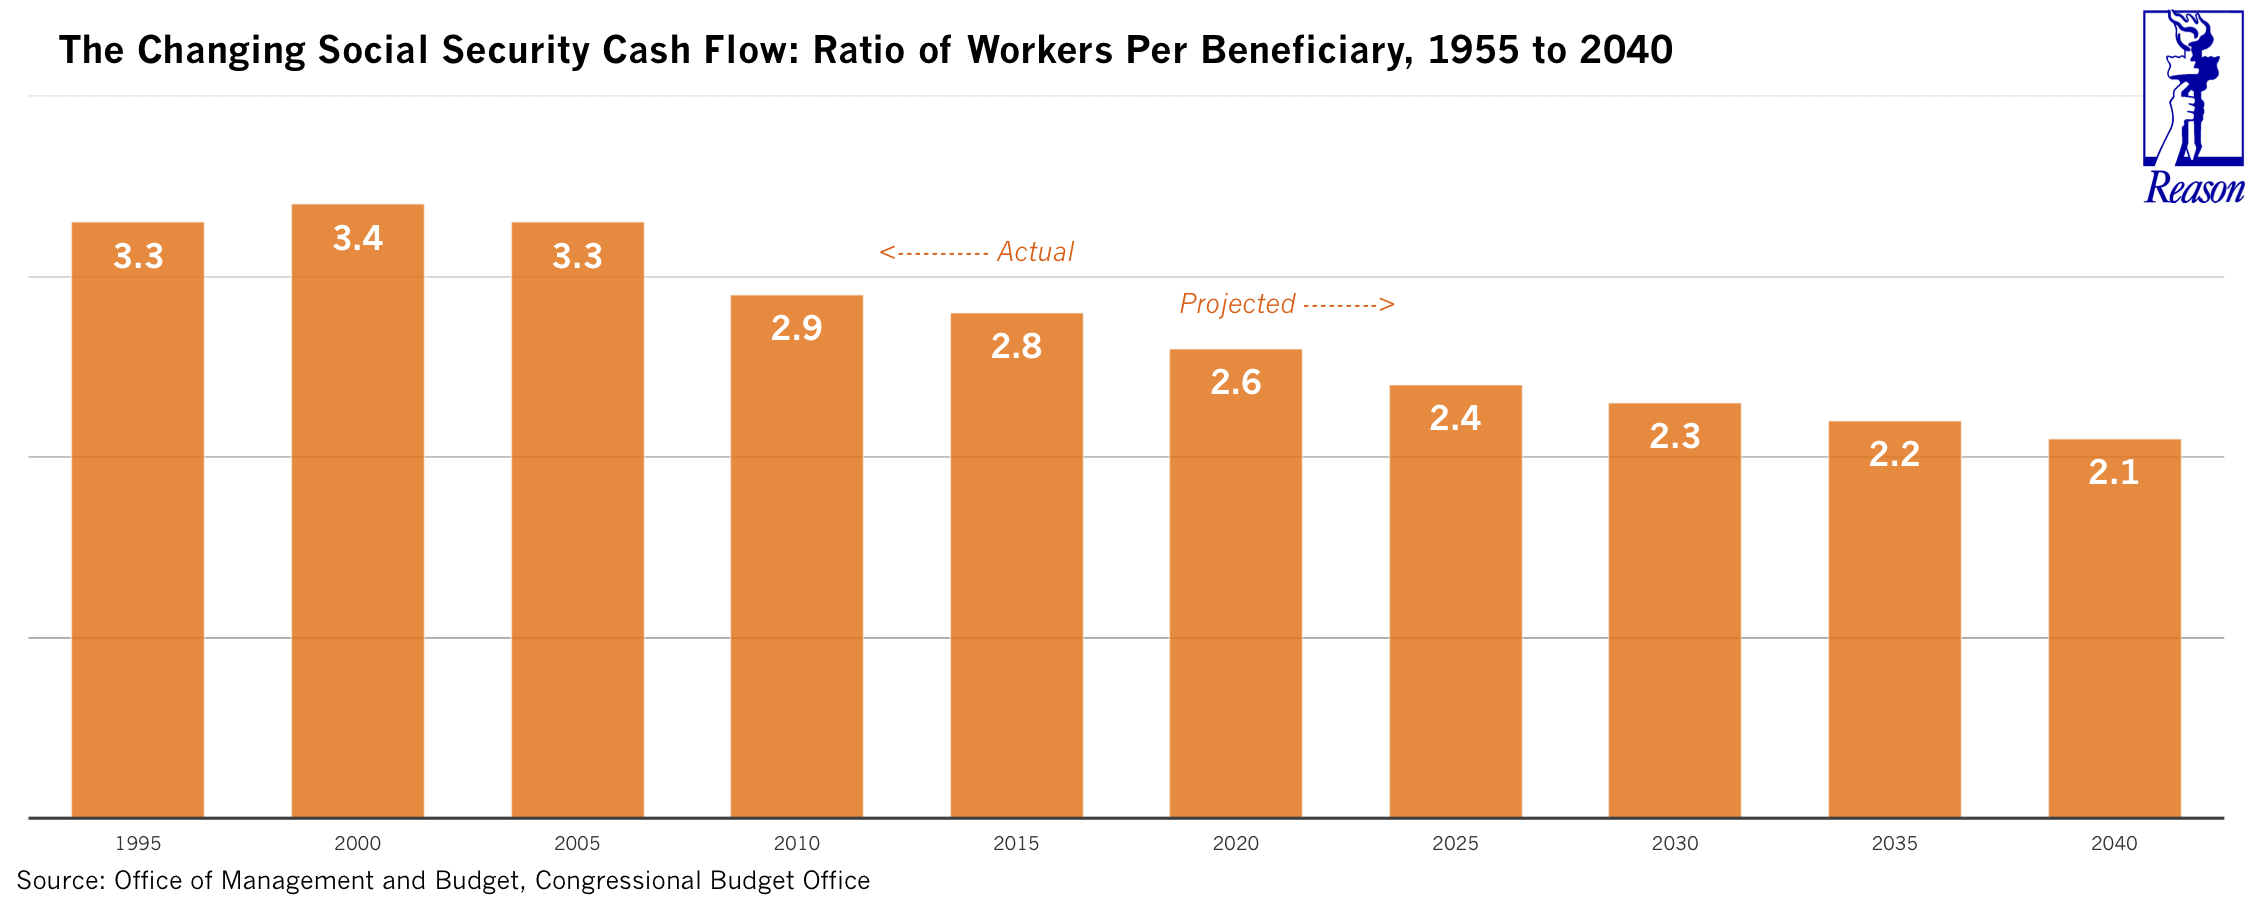
The pressure Baby Boomer retirements place on the federal budget comes from two sources. First, the flow of contributions into the Social Security Trust Fund will continue to decline relative to benefits paid out. Figure 3 shows the declining ratio of workers to retired Social Security beneficiaries. Before Boomers began retiring in 2008, there were 3.3 workers per retiree. By 2030, the ratio is expected to fall to 2.3.
Figure 3:
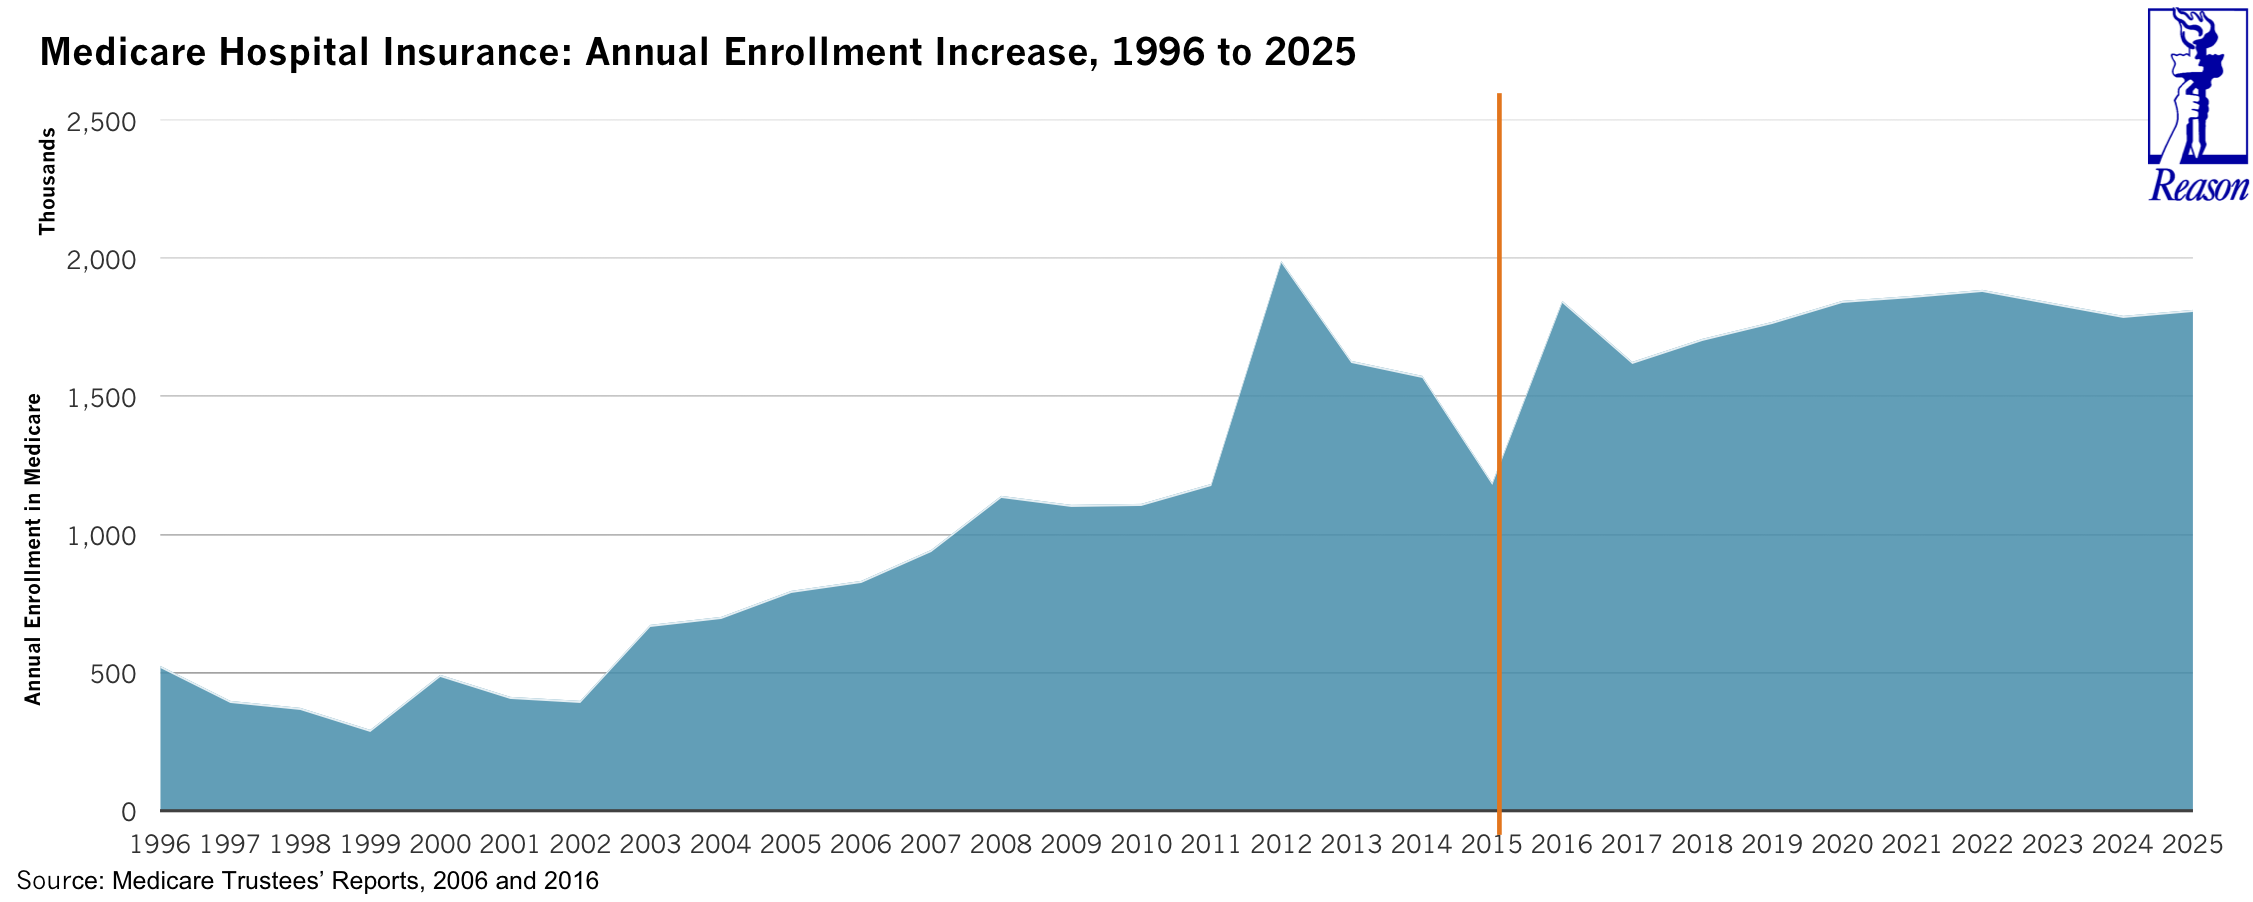
Second, the increase in Boomer retirements means increased pressure on Medicare. In the 1990s and early 2000s, annual enrollment increases in Medicare’s hospital insurance program were routinely below one million. Since 2008, the annual enrollment increase has ranged between 1.1 million and 1.9 million, and is expected to continue in that range for the next several years, as shown in Figure 4.
Figure 4:
1.4 Increased Life Expectancy Likely Means Medical Cost Inflation
The CBO projects widening federal deficits even as the Boomers pass away, with the red ink forecast to reach 8.8% of GDP by 2046. This is partially attributable to increased life expectancy. Between 2002 and 2027, the full Social Security normal retirement age is rising from 65 to 67. This increase roughly mirrors the increase in life expectancy of individuals entering retirement: in the 25-year period ending 2014, life expectancy at age 65 rose from 17.1 years to 19.3 years.
The CBO projects a further increase in life expectancy at age 65 to 20.2 years in 2027 and 21.6 years in 2046, but no further changes in retirement age are planned. The increase in Social Security normal retirement age was legislated as part of a bipartisan plan to strengthen the program in 1983. But proposals for similar reforms, like those offered by the Simpson Bowles Commission, have failed to gain traction in recent years. As a result, Social Security beneficiaries will receive checks for longer periods of time. The ratio of Social Security beneficiaries to those paying FICA taxes will continue to rise, rendering the program unsustainable.
This is also true of Medicare, whose eligibility age has remained at 65 since the program’s inception. According to the Medicare Trustee’s report, Medicare enrollment increased from 39.7 million (or 14.1% of the U.S. population) in 2000 to 55.3 million (or 17.2% of the U.S. population) in 2015. By 2030, the Trustees project that enrollment will grow to 81.2 million, or 22.3% of the nation’s population.
Medicare (and other federal health care entitlements) are also affected by the increasing cost of health care. Between 2000 and 2015, annual medical price inflation has exceeded general price inflation by an average of 1.5%. During this period, health care spending grew from 13.3% to an estimated 17.7% of GDP. Rising medical costs are the result of a number of factors, including the introduction of new, more expensive drugs and other technologies, and reduced competition as hospital groups and other providers continue to merge.
The federal budget is increasingly exposed to medical cost inflation because of both population aging and the federal government’s greater role in health care provision. The 2010 Affordable Care Act is just the most recent expansion of federal health care responsibility. The fact that a Republican Congress established the Children’s Health Insurance Plan in 1997 and President George W. Bush added prescription drug coverage to Medicare in 2003 shows that federal health initiatives have had bipartisan support. As a result of these changes, health care entitlements now represent over 26% of federal spending.
1.5 High Deficits Have Meant Increasing Debt Payments
Years of deficits under both the Bush and Obama administrations have driven up the nation’s debt. But while there is widespread awareness that the national debt has gone up, headline debt numbers do not completely capture the degree to which the federal government is under water and unable to meet the many commitments it has made.
As of June 30, 2016 the national debt totaled $19.51 trillion or 106% of GDP. Much of the federal debt is held by federal agencies. The largest governmental holders of Treasury debt are the Social Security and Medicare trust funds ($3.08 trillion), the federal Civil Service Retirement and Disability Fund ($0.84 trillion) and the Military Retirement Fund ($0.60 trillion).
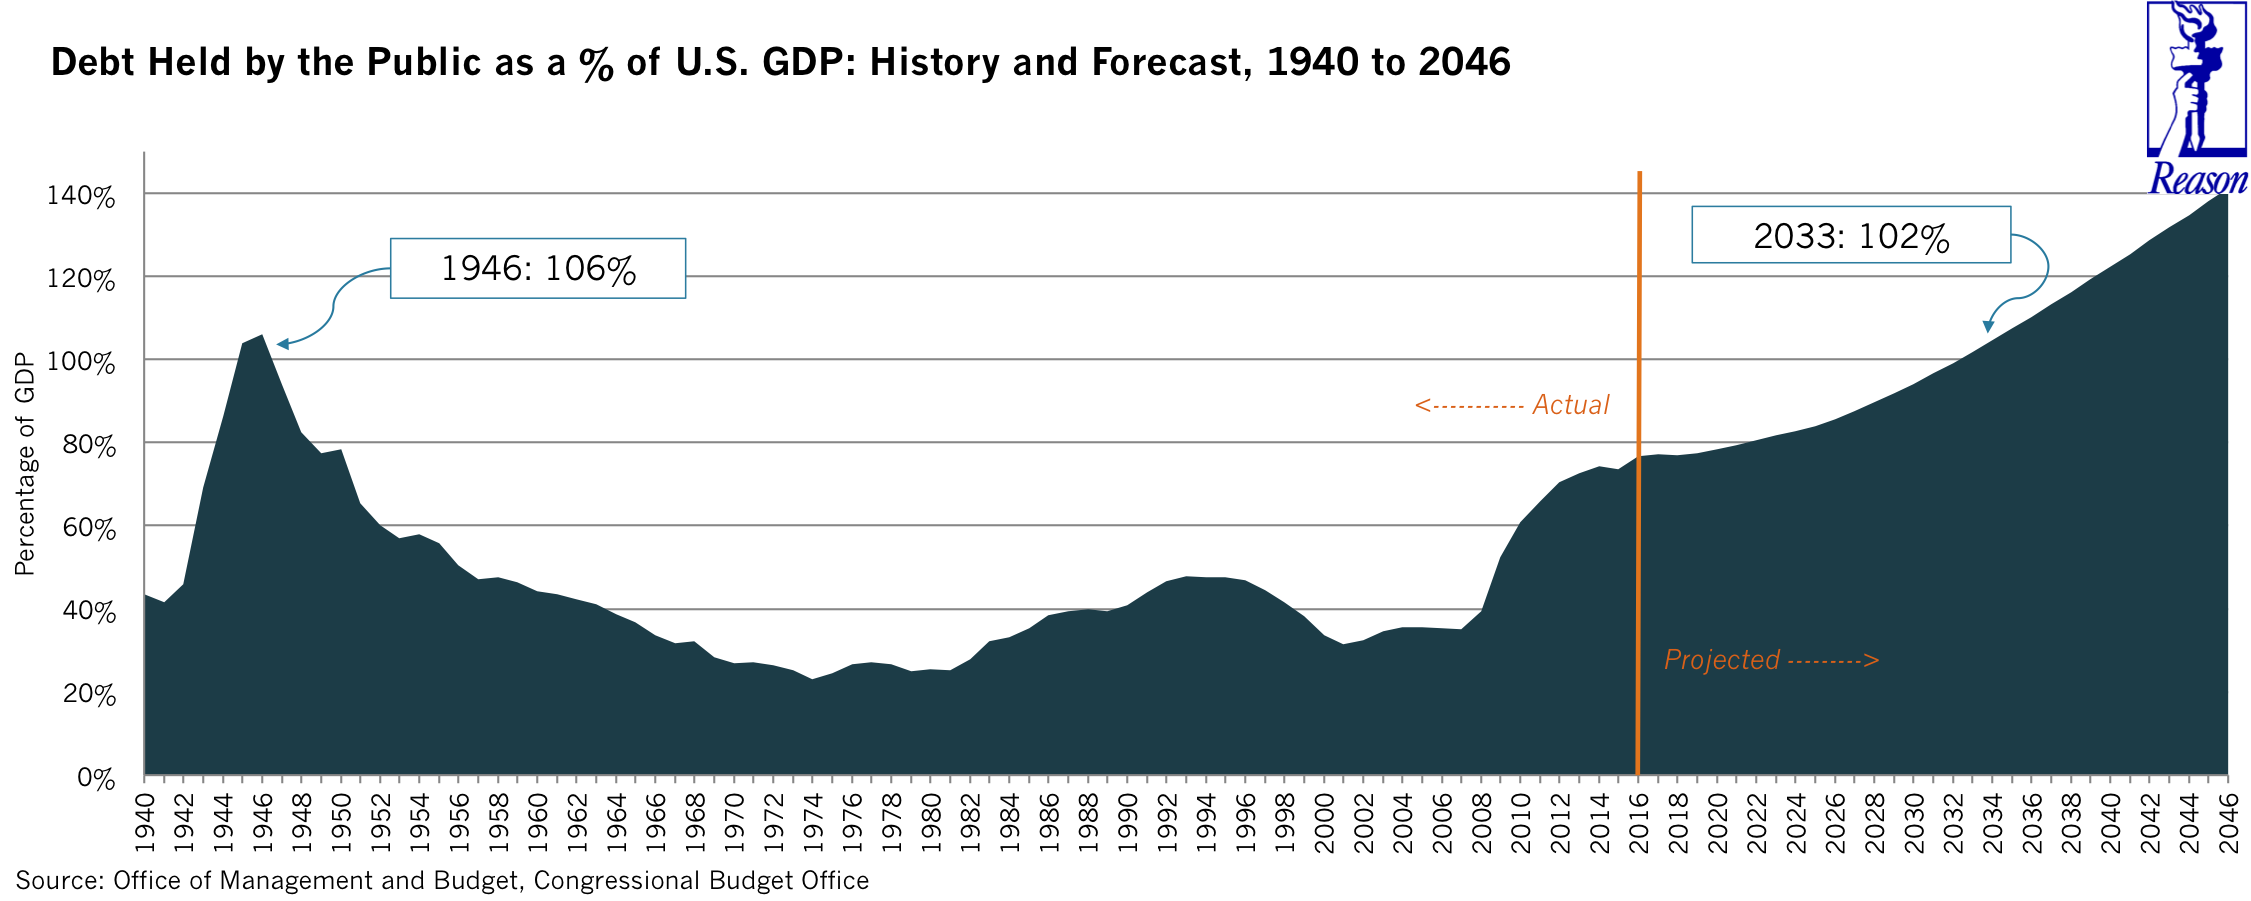
Government debt heldoutside the government, known as Public Debt, was $14.10 trillion, or 76% of GDP. The Public-Debt-to-GDP ratio has risen sharply since the beginning of the Bush administration when it was only 31%. The CBO’s long-term outlook, shown in Figure 5, projects this ratio widening from today’s 76% to 141% by 2046, eclipsing the previous peak of 106% reached at the end of World War II.
Figure 5:
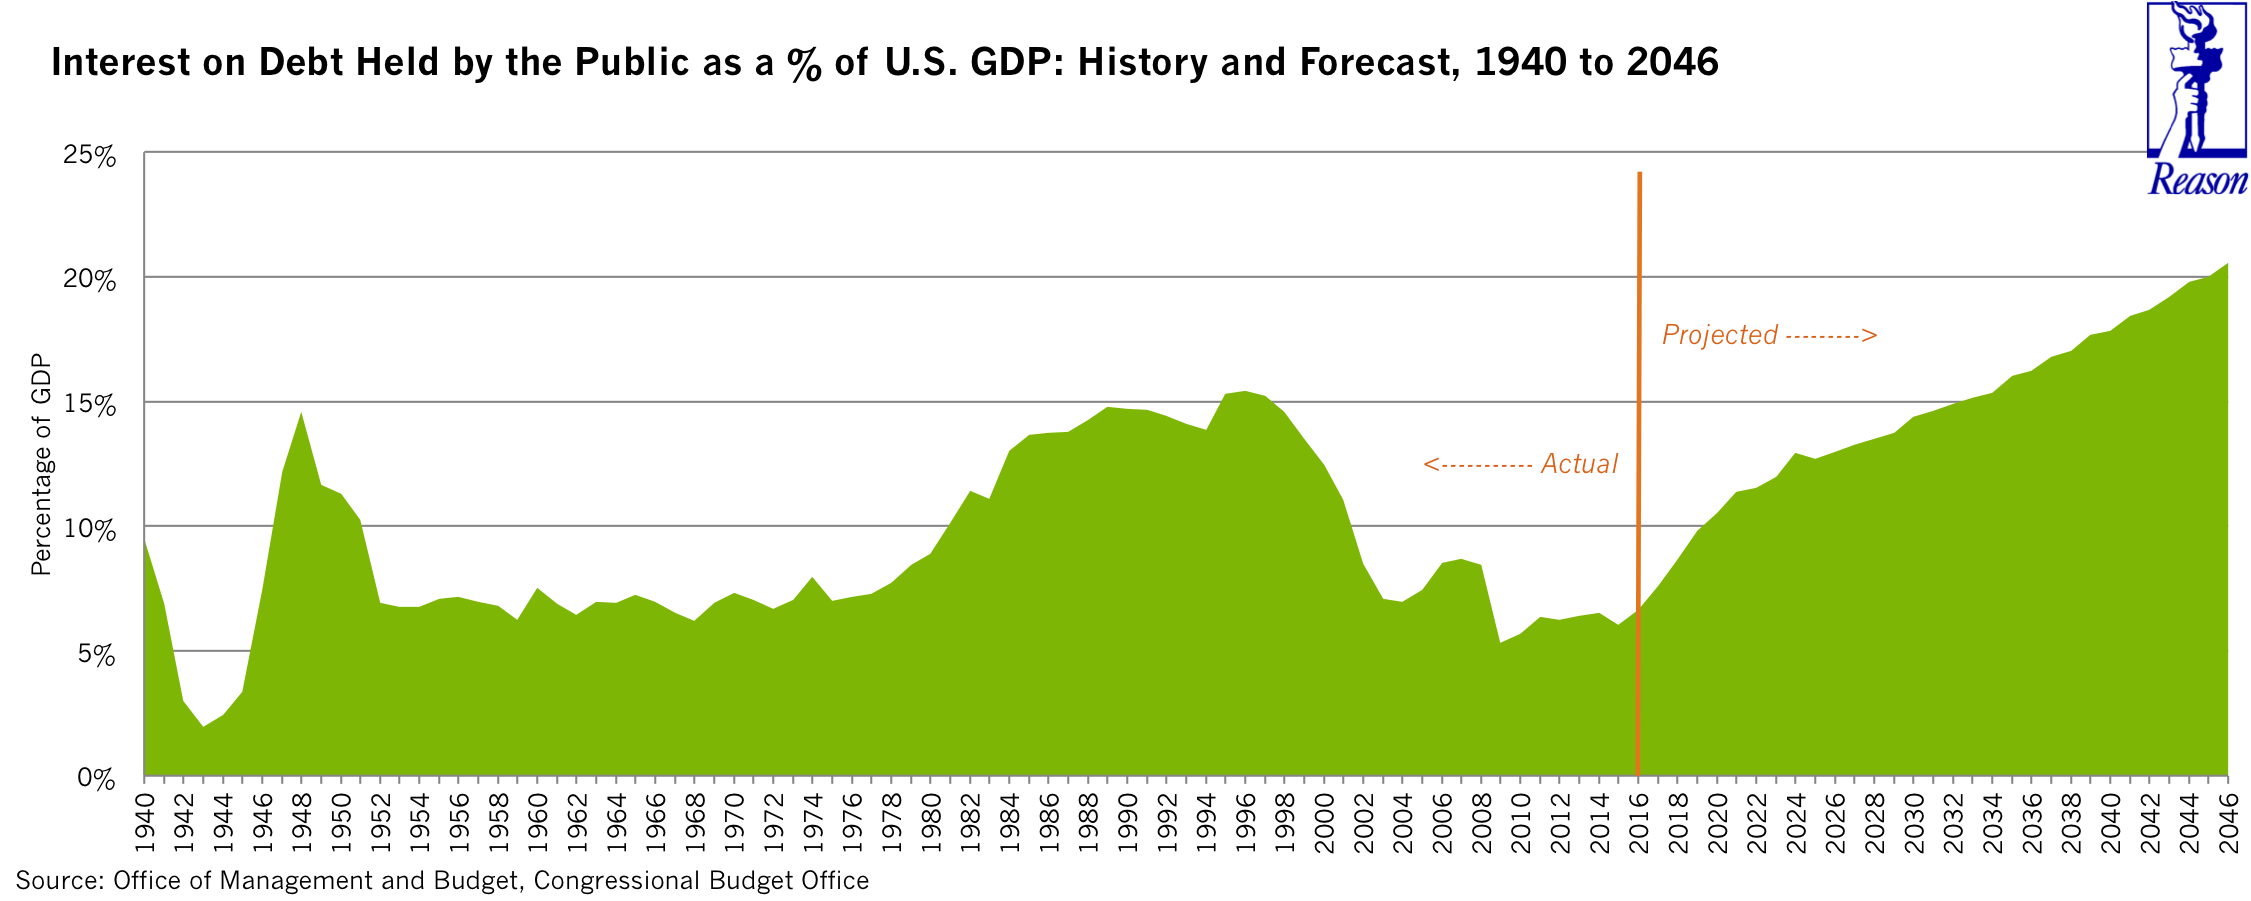
In an environment of persistent deficits, the trend toward increasing federal debt is self-reinforcing because Treasury bonds earn interest. For any given rate of interest, the more government bonds the public holds, the more interest the government must pay. Even though interest rates are at historic lows today, the federal government will nonetheless pay $250 billion in interest, accounting for 6.5% of total spending, as shown in Figure 6. The CBO expects this number to rise sharply in upcoming years as the stock of debt increases and interest rates converge toward historical medians.
Figure 6:
1.6 Total Federal Obligations Are Much Larger than Reported
The debt-to-GDP ratios discussed here understate the size of the government’s indebtedness because they exclude unfunded pension and retirement benefit liabilities. Put another way, the federal government has both explicit debt (held by the public) as well as implicit debt (unfunded commitments).
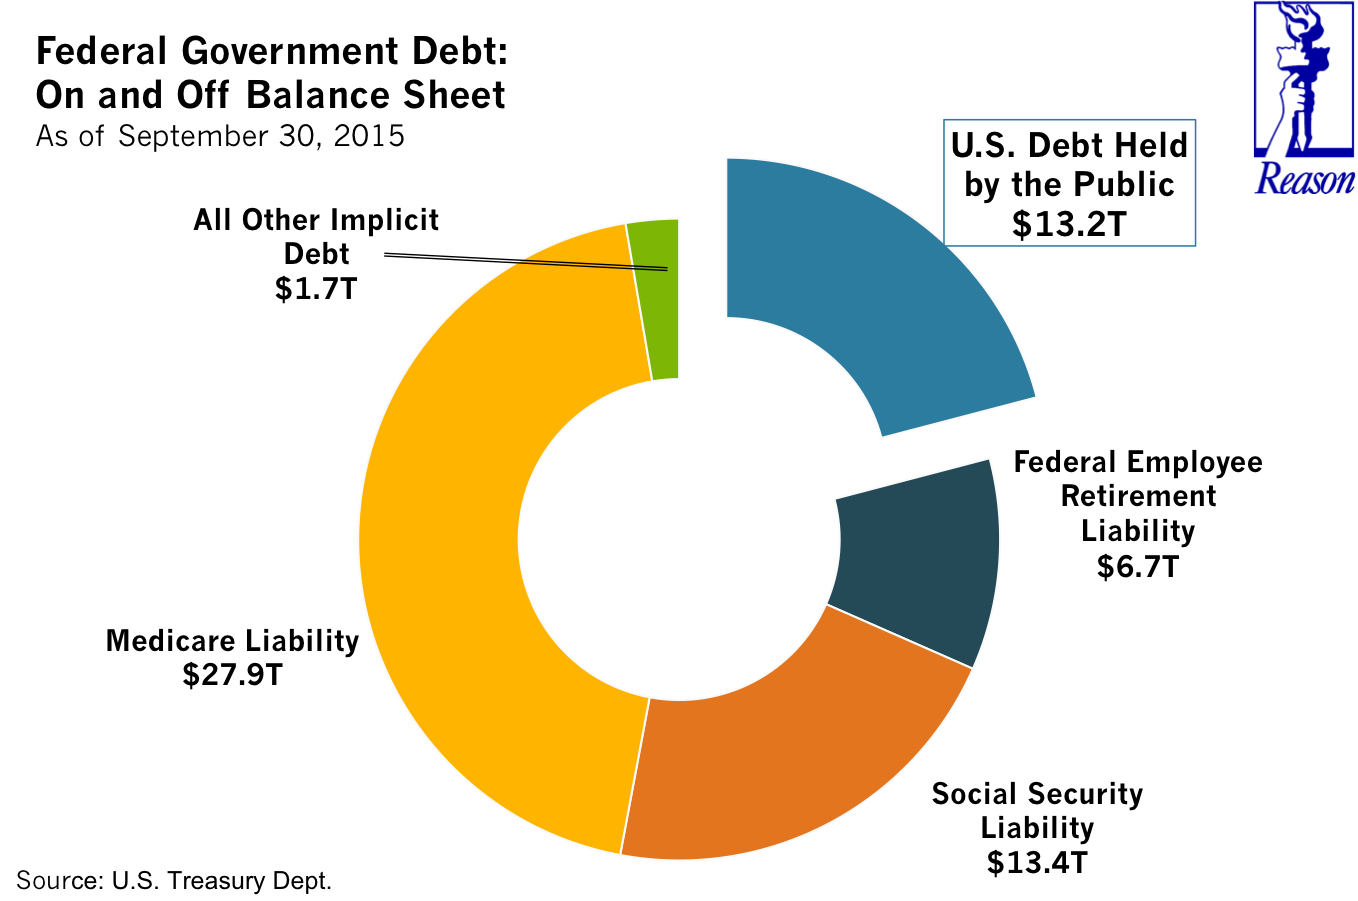
U.S. state and local governments must report these implicit, unfunded commitments on their balance sheets under governmental accounting standards. On its balance sheet, the federal government recognizes $6.72 trillion of pension and benefit liabilities owed to federal civilian employees and veterans—though this is not counted toward the “official” federal debt that is held by the public in the form of bonds.
The federal financial statements also show Social Security and Medicare liabilities as “off balance sheet items” in separate Statements of Social Insurance. In 2015, these obligations totaled $41.38 trillion—dwarfing the $3.08 trillion in Treasury securities held by the social insurance trust funds. Another $0.11 trillion was owed to railroad retirees. Again, all of this is implicit debt, not reflected in the debt held by the public figures.
Finally, the federal balance sheet includes a number of other significant liabilities such as those incurred by the Pension Benefit Guaranty Corporation (PBGC), which insures payments to retirees in private sector pension systems.
Figure 7 shows reported federal liabilities, both on and off the balance sheet. These obligations total $62.96 trillion. After considering the federal government’s financial assets of $3.23 trillion, that leaves a negative net position of $59.73 trillion—more than triple the nation’s gross domestic product.
Some private estimates of the government’s overall fiscal position paint an even bleaker picture. For example, Lawrence Kotlikoff and Adam Michel have estimated that the federal government faces an overall fiscal gap of $210 trillion. This fiscal gap reflects the present value of all projected revenues and expenditures over an infinite time horizon.
Figure 7:
Part 2: Addressing the Problem and Evaluating the Candidates’ Plans
2.1 A Libertarian Approach to Fiscal Sustainability
The federal debt could be accomplished by increasing tax revenue, cutting aggregate spending, or some combination of the two. Libertarians generally oppose tax increases because they are coercive; they also tend to reduce economic growth.
Paradoxically, revenue could be increased through tax cuts. Reducing the corporate tax rate, for example, would boost revenue by encouraging businesses to repatriate more of the income they earn overseas, as well as by increasing investment, which would generate higher rates of economic growth. The Tax Foundation estimates that cutting the corporate tax rate to between 10% and 15% might increase net revenue by 0.2% to 0.3%.
However, tax cuts alone are not likely to significantly affect deficits. To cut deficits it will be necessary to cut spending. One important change would be to raise the eligibility age for Social Security, Social Security Disability Insurance, and Medicare and index them to life expectancy. In addition, these programs should be subject to more robust and sound means testing; to avoid perverse incentives and outcomes, the test could be based on lifetime earnings. Medicaid should be converted to a block grant program, as recently proposed by House Republicans. And individuals should be incentivized to switch to a system of low-fee personalized retirement savings accounts, which eventually should replace the Social Security program all together. The collective goal of these changes would be to replace, over time, existing open-ended entitlements with programs that have lower and less volatile liabilities.
Spending cuts don’t have to solely appeal to the political right, however. Defense spending could be cut by about 50% without substantially affecting national security; in some cases, cuts—such as the closure of U.S. bases on foreign soil—would likely improve national security. And corporate tax expenditures and subsidies, which amount to “corporate welfare,” should be terminated.
Finally, although domestic discretionary spending is a relatively small component of overall spending, it still contains numerous opportunities for savings. Federal departments without clear, constitutionally enumerated powers—such as the Departments of Education, Energy, and Housing and Urban Development—should be closed, with their functions passed to the states or private organizations. Ending the war on drugs would reduce unnecessary expenditures on enforcement and incarceration, while eliminating the economic harm done by this assault on individual liberty. Other discretionary spending can also be cut through the rigorous implementation of zero-based budgeting, a technique under which all programs are reviewed regularly and eliminated if they are found to be outmoded or ineffective.
2.2 Proposals from the Presidential Candidates
So, how do the presidential candidates propose to address the nation’s fiscal problems, and how do they compare to the ideal outlined?
The Issues page of Hillary Clinton’s campaign website does not list the debt or deficits among the topics on which she has a position. Her site does address Social Security and Medicare. Clinton proposes to increase Social Security survivor benefits and to give earnings credit to those who took time out of the workforce to take care of children, parents or other relatives. She proposes to offset these extra expenditures by increasing the earnings cap to which Social Security taxes are applied and taxing unearned income. The site does not provide sufficient detail to allow the cost of additional benefits or the revenue from new taxes to be estimated.
With respect to Medicare, Clinton offers specific proposals for reducing prescription costs including allowing Americans to import drugs from abroad, expediting FDA approval of lower-cost generic and biosimilar drugs, and allowing Medicare to negotiate drug prices. These reforms might cut spending a little, but the effect on the overall budget would be limited by the relatively low proportion of health spending represented by prescription drugs (9.8% of total health spending in 2014).
With respect to other areas of the budget, Clinton calls for increased spending on infrastructure, aid for college students, paid family leave, universal pre-school, Alzheimer’s research, and other priorities. The Center for a Responsible Federal Budget (CRFB) estimates that these new initiatives will cost between $1.40 trillion and $2.55 trillion over 10 years.
Clinton proposes to offset these new expenditures by raising taxes on high-income individuals and preventing corporate inversions (in which a U.S. entity avoids corporate income tax by being acquired by a foreign company). CRFB estimates that her tax proposals would increase revenue between $0.90 trillion and $1.60 trillion over 10 years. When the effects of her health care policy and immigration proposals are included, CRFB estimates the 10-year impact of the candidate’s policies to be between a deficit reduction of $0.15 trillion and an increase of $2.20 trillion.
Donald Trump’s website contains a short video focusing on the debt and its unfairness to young people. His proposed solution is to stimulate the economy by lowering tax rates. Trump’s original tax plan called for exempting low earners from the tax rolls, reducing marginal tax rates, and limiting certain deductions. A Tax Foundation analysis found that Trump’s initial plan would spur economic growth, but that the added economic activity would not be sufficient to offset the revenue losses stemming from the proposal’s lower rates. It estimates that the plan, if implemented, would reduce federal revenues by $10.1 trillion over 10 years and add substantial interest costs. (Trump offered a less ambitious tax plan in September 2016; the Tax Foundation has estimated that it will reduce revenues by about $3.3 trillion over 10 years.)
On the expenditure side, Trump’s proposals are difficult to assess. However, he has ruled out changes in Social Security and has not offered a plan to reform Medicare, which will make it difficult for him to achieve large savings.CRFB estimates that the overall impact of Trump’s revenue and expenditure policies would increase the deficit over ten years by between $9.70 trillion and $16.30 trillion.
Green Party candidate Jill Stein does not specifically address the deficit and debt on her website, although she does call for a 50% reduction in the defense budget and full disclosure of corporate subsidies in the federal budget. She would also increase the progressivity of the tax code and impose a carbon tax, but would also institute a costly Medicare for All entitlement and free universal child care.
Libertarian Gary Johnson’s website identifies the national debt as a major issue and proposes to submit a balanced budget to Congress as his first major act in office. The site does not list specific spending cuts that Johnson would make. There is also no discussion of entitlement reform on Johnson’s website, but the candidate has previously called for raising the retirement age. In 2016, he has called for eliminating the Department of Education and avoiding overseas conflicts.
Although Johnson is short on specifics, his overall direction is closest to our own. Clinton and Stein don’t directly address the deficit, while Trump relies on dubious estimations of the dynamic effects of tax cuts to achieve deficit reduction.
Part 3: Conclusion
Recent cyclical improvements in the deficit notwithstanding, the federal government continues on an unsustainable fiscal trajectory. Unsustainable trends eventually must end, and this one is most likely to end in some form of fiscal crisis unless fundamental reforms are implemented.
While the two major party candidates have not offered workable solutions to this problem, Gary Johnson is pointing in the right direction—although more specificity is needed. The very detailed House Republican plan has some useful ideas, but it is unlikely that there will be a complete termination of Affordable Care Act spending as their proposal suggests. Aside from controlling Social Security, Medicaid and Medicare costs, a balanced plan would also have to include indexing the retirement age to longevity, right-sizing the nation’s military and applying zero-based budgeting to domestic programs.
.
About the Author
Marc D. Joffe founded Public Sector Credit Solutions in 2011 to educate the public about government debt. Before founding PSCS, Marc was a Senior Director at Moody’s Analytics. He has an MBA from New York University and an MPA from San Francisco State University.
.
Footnote
[1] This study relies heavily on CBO data available at https://www.cbo.gov/about/products/budget_economic_data.