

Statistics published by the Illinois Department of Insurance show many local pension plans with funded ratios at, or below, 50 percent. The implication is that Chicago is not the only Illinois city facing budget pressures arising from retiree obligations. But to determine which Illinois cities are facing the biggest challenges, it is necessary to crunch the numbers from their financial reports.
Unfunded legacy costs —such as pension and other post-employment benefits— reduce budgetary resources available for core government services. In extreme cases, this crowd out effect can lead to a municipal bond default or a bankruptcy filing. More often, crowd out results in a condition known as service insolvency in which the government entity continues to pay its bills but is unable to provide public services at the level residents might reasonably expect. Service insolvency can manifest itself in a variety of ways, from slow or delayed 9-1-1 response times to reduced library hours to facility brownouts and closures.
While analysis of the budgetary impact of retirement costs often focuses on states, the bigger risk of service insolvency and even financial insolvency is at the local level. Employee compensation usually represents a larger portion of local government revenues and expenses, and, at least in some states, local governments have fewer options for raising revenues.
For both state and local governments, assessing the risk of service or financial insolvency requires multiple calculations. It is not sufficient, for example, to just look at the funded ratio of a pension plan in which the government participates. Even a severely unfunded plan may have minimal impact if the size of the unfunded liability is small relative to the government’s total revenue.
Michael Cembalest at JP Morgan developed a standardized measure of a government’s ability to meet its pension and other long-term obligations. Cembalest’s credit ratio (which he calls an “IPOD ratio” — see graphic below) considers the total of interest on direct debt (typically bonds) and payments for defined-contribution pension plans, as well as defined-benefit pension and other post-employment benefits (OPEB) costs.
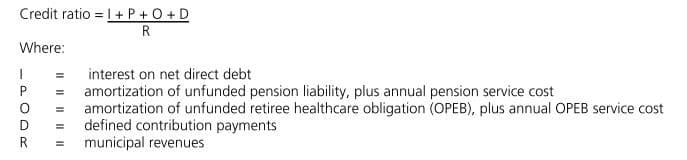
Cembalest also standardizes debt service costs, using a set of constant assumptions.
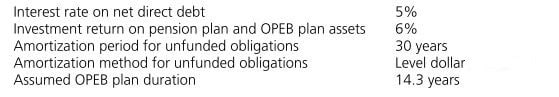
This approach controls for variations across assumptions that different governments and pension plans use. A government does not get a better score simply by virtue of using more aggressive assumptions in its financial reports.
Municipal finance expert Natalie Cohen wrote favorably about Cembalest’s approach in a November 2017 blog post. Cohen said, “To see if a government is headed for bankruptcy, it is more appropriate to look at the total cost of fixed obligations as a percent of the government’s budget. These include debt service, pension and OPEB according to what the government should be contributing rather than what they actually contribute.”
Cohen goes on to argue that the fixed cost should be compared to “own source revenues”, i.e. revenues that do not come from intergovernmental grants. This is particularly a concern when analyzing states because they receive a large amount of federal Medicaid funding that is earmarked for that program. Such revenues are theoretically unavailable for debt service and should thus not be included in the denominator of the IPOD ratio.
In a 2017 analysis, Cembalest calculated IPOD ratios for 105 US city and county governments. Chicago had the highest (i.e., the worst) ratio (62 percent), well above that reported for the second-worst government— Lubbock, Texas (54 percent). The only other Illinois entity In Cembalest’s sample, Cook County, had a ratio that was close to the local government median of 30 percent.
Applying JP Morgan’s Framework to Smaller Illinois Cities
The Illinois Insurance Department data shows that a dozen Illinois cities have pension plans that have funding levels of 50 percent or below and actuarial liabilities of $100 million or more. I obtained 2017 Comprehensive Annual Financial Reports (CAFRs) for these cities and computed an IPOD-style score for each city. These scores are not true JP Morgan IPOD scores because the methodology and data inputs are not fully documented – which is understandable for a commercially developed tool used primarily at the bank for asset management purposes.
The results of my analysis are below:
| City | Worst Funded System | Worst Funded System Ratio | City’s IPOD-Style Score |
| Chicago | Chicago Firemen’s Pension Fund | 19.6% | 52% |
| Chicago Heights | Chicago Heights Police Pension Fund | 46.1% | 26% |
| Cicero | Cicero Firefighters’ Pension Fund | 28.7% | 25% |
| Des Plaines | Des Plaines Police Pension Fund | 46.3% | 15% |
| Elgin | Elgin Firefighters Pension Fund | 49.4% | 21% |
| Evanston | Evanston Firefighters Pension Fund | 47.7% | 23% |
| Moline | Moline Firefighters Pension Fund | 29.6% | 25% |
| Oak Lawn | Oak Lawn Police Pension Fund | 48.1% | 22% |
| Oak Park | Oak Park Firefighters Pension Fund | 42.3% | 22% |
| Rockford | Rockford Firefighters Pension Fund | 48.1% | 22% |
| Skokie | Skokie Firefighters Pension Fund | 46.0% | 31% |
| Springfield | Springfield Firefighter’s Pension Fund | 43.9% | 31% |
| Waukegan | Waukegan Firefighters Pension Fund | 47.8% | 28% |
The score I calculated for Chicago, 52 percent, was significantly lower than the 62 percent reported by JP Morgan. This may be due to the fact that this analysis only excluded a very small proportion of revenues from the denominator of the IPOD equation. In any case, the comparison across cities is more relevant for our purposes here.
One significant finding is that Chicago appears to be in much worse shape than the smaller Illinois cities. Apparently, Chicago’s plight is a singular phenomenon. Although the smaller cities have deeply underfunded public safety pension systems, their non-safety employees (known as “miscellaneous employees”) participate in the relatively strong Illinois Municipal Retirement Fund (IMRF), which reported a 97 percent funded ratio in 2017.
That said, there is a lot of variation among the smaller cities, with several showing significant stress.
One city that appears especially challenged is the state capitol, Springfield. Much of Springfield’s debt service obligations are related to its other post-employment benefits. The city’s 2017 Comprehensive Annual Financial Report (CAFR) showed an unfunded OPEB liability of $431 million—almost equal to total city revenues that year. But the city’s 2018 CAFR, already available due to Springfield’s early fiscal year-end, showed a much lower unfunded OPEB liability of $321 million. This helped lower the city’s IPOD score from 31 percent to 27 percent. Springfield’s reduced OPEB liability was attributable to assumption changes and program changes. Employees and retirees are now paying a larger proportion of their health care costs.
Conclusion
Across Illinois, cities are struggling with pension, OPEB and debt service burdens as the state’s population shrinks. Fortunately, none of the mid-sized cities reviewed here exhibit fiscal distress on a par with Chicago’s problems. Even though they have deeply underfunded public safety plans, they benefit by participating in a relatively well funded statewide plan for non-uniformed staff. To remain above water, these cities will have to control their OPEB and municipal bond obligations, while improving funding levels for their public safety plans.
Many thanks to my colleague Truong Bui for his help calculating the IPOD scores.