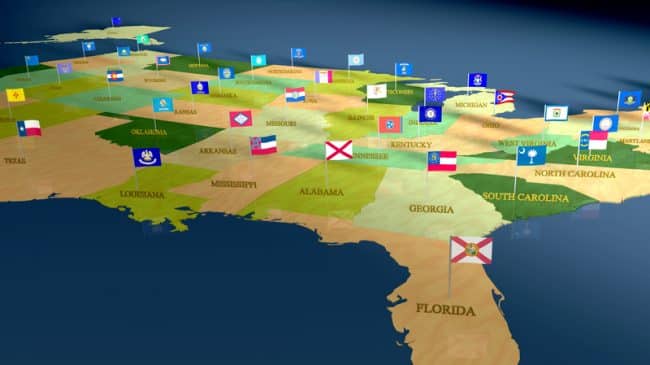
Reason Foundation’s Annual Highway Report is based on spending and performance data submitted by state highway agencies to the federal government for 2012 except on urban Interstate congestion. The federal government has not made the necessary urban Interstate congestion data available since 2009, so this report uses 2011 (the most recent year available) congestion data from the Texas A&M Transportation Institute. The report’s dataset includes Interstate, federal and state roads but not county or local roads. Each ranking represents a percentage. For example, the state ranking first in deficient bridges has the smallest percentage of deficient bridges, not necessarily the smallest raw number of deficient bridges. Click on a state below for its overall ranking and performance in each category. The complete Annual Highway Report is here.
 Alabama Alabama |
Alabama ranks 21st in the nation in highway performance and cost-effectiveness in the Annual Highway Report by Reason Foundation.
Alabama ranks 36th in fatality rate, 23rd in deficient bridges, 32nd in rural Interstate pavement condition, 35 th in urban Interstate pavement condition and 16th in urban Interstate congestion.
On spending, Alabama ranks 21st in total disbursements per mile and 32nd in administrative disbursements per mile.
Alabama’s best rankings are urban Interstate congestion (16th), rural arterial pavement condition (18th) and maintenance disbursements per mile (18th).
Alabama’s worst rankings are fatality rate (36th) and urban Interstate pavement condition (35th).
Alabama’s state-controlled highway mileage makes it the 25th largest system.
Alabama’s Complete Results
Overall Rank in 2012: 21st
Overall Rank in 2011: 28th
Overall Rank in 2009: 27th
| Performance by Category in 2012 | Ranking |
| Total Disbursements per Mile | 21 |
| Capital and Bridge Disbursements per Mile | 26 |
| Maintenance Disbursements per Mile | 18 |
| Administrative Disbursements per Mile | 32 |
| Rural Interstate Pavement Condition | 32 |
| Rural Arterial Pavement Condition | 18 |
| Urban Interstate Pavement Condition | 35 |
| Urban Interstate Congestion | 16 |
| Deficient Bridges | 23 |
| Fatality Rate | 36 |
| Narrow Rural Arterial Lanes | 27 |
| Overall Performance | 21 |
 Alaska Alaska |
Alaska ranks 49th in the nation in highway performance and cost-effectiveness in the Annual Highway Report by Reason Foundation.
Alaska ranks 29th in fatality rate, 26th in deficient bridges, 48th in rural Interstate pavement condition, 30 th in urban Interstate pavement condition and 11th in urban Interstate congestion.
On spending, Alaska ranks 16th in total disbursements per mile and 21st in administrative disbursements per mile.
Alaska’s best rankings are urban Interstate congestion (11th), capital bridge disbursements per mile (14th) and total disbursements per mile (16th).
Alaska’s worst rankings are rural arterial pavement condition (50th) and rural Interstate pavement condition (48th).
Alaska’s state-controlled highway mileage makes it the 36th largest system.
Alaska’s Complete Results
Overall Rank in 2012: 49th
Overall Rank in 2011: 48th
Overall Rank in 2009: 50th
| Performance by Category in 2012 | Ranking |
| Total Disbursements per Mile | 16 |
| Capital and Bridge Disbursements per Mile | 14 |
| Maintenance Disbursements per Mile | 33 |
| Administrative Disbursements per Mile | 21 |
| Rural Interstate Pavement Condition | 48 |
| Rural Arterial Pavement Condition | 50 |
| Urban Interstate Pavement Condition | 30 |
| Urban Interstate Congestion | 11 |
| Deficient Bridges | 26 |
| Fatality Rate | 29 |
| Narrow Rural Arterial Lanes | 20 |
| Overall Performance | 49 |
 Arizona Arizona |
Arizona ranks 19th in the nation in highway performance and cost-effectiveness in the Annual Highway Report by Reason Foundation.
Arizona ranks 37th in fatality rate, 2nd in deficient bridges, 26th in rural Interstate pavement condition, 8th in urban Interstate pavement condition and 38th in urban Interstate congestion.
On spending, Arizona ranks 39th in total disbursements per mile and 35th in administrative disbursements per mile.
Arizona’s best rankings are narrow rural arterial lanes (1st), deficient bridges (2nd) and urban Interstate pavement condition (8 th).
Arizona’s worst rankings are total disbursements per mile (39th) and urban Interstate congestion (38th).
Arizona’s state-controlled highway mileage makes it the 38th largest system.
Arizona’s Complete Results
Overall Rank in 2012: 19th
Overall Rank in 2011: 21st
Overall Rank in 2009: 23rd
| Performance by Category in 2012 | Ranking |
| Total Disbursements per Mile | 39 |
| Capital and Bridge Disbursements per Mile | 37 |
| Maintenance Disbursements per Mile | 24 |
| Administrative Disbursements per Mile | 35 |
| Rural Interstate Pavement Condition | 26 |
| Rural Arterial Pavement Condition | 34 |
| Urban Interstate Pavement Condition | 8 |
| Urban Interstate Congestion | 38 |
| Deficient Bridges | 2 |
| Fatality Rate | 37 |
| Narrow Rural Arterial Lanes | 1 |
| Overall Performance | 19 |
Arkansas ranks 35th in the nation in highway performance and cost-effectiveness in the Annual Highway Report by Reason Foundation.
Arkansas ranks 46th in fatality rate, 18th in deficient bridges, 44th in rural Interstate pavement condition, 47 th in urban Interstate pavement condition and 18th in urban Interstate congestion.
On spending, Arkansas ranks 9th in total disbursements per mile and 3rd in administrative disbursements per mile.
Arkansas’s best rankings are administrative disbursements per mile (3rd), total disbursements per mile (9th) and maintenance disbursements per mile (10th).
Arkansas’s worst rankings are narrow rural arterial lanes (47th) and urban Interstate pavement condition (47th).
Arkansas’s state-controlled highway mileage makes it the 16th largest system.
Arkansas’s Complete Results
Overall Rank in 2012: 35th
Overall Rank in 2011: 37th
Overall Rank in 2009: 36th
| Performance by Category in 2012 | Ranking |
| Total Disbursements per Mile | 9 |
| Capital and Bridge Disbursements per Mile | 12 |
| Maintenance Disbursements per Mile | 10 |
| Administrative Disbursements per Mile | 3 |
| Rural Interstate Pavement Condition | 44 |
| Rural Arterial Pavement Condition | 31 |
| Urban Interstate Pavement Condition | 47 |
| Urban Interstate Congestion | 18 |
| Deficient Bridges | 18 |
| Fatality Rate | 46 |
| Narrow Rural Arterial Lanes | 47 |
| Overall Performance | 35 |
California ranks 45th in the nation in highway performance and cost-effectiveness in the Annual Highway Report by Reason Foundation.
California ranks 9th in fatality rate, 1st in deficient bridges, 46th in rural Interstate pavement condition, 49 th in urban Interstate pavement condition and 46th in urban Interstate congestion.
On spending, California ranks 46th in total disbursements per mile and 47th in administrative disbursements per mile.
California’s best rankings are deficient bridges (1st), fatality rate (9th) and narrow rural arterial lanes (33rd).
California’s worst rankings are maintenance disbursements per mile (49th) and urban Interstate pavement condition (49th).
California’s state-controlled highway mileage makes it the 11th largest system.
California’s Complete Results
Overall Rank in 2012: 45th
Overall Rank in 2011: 46th
Overall Rank in 2009: 47th
| Performance by Category in 2012 | Ranking |
| Total Disbursements per Mile | 46 |
| Capital and Bridge Disbursements per Mile | 45 |
| Maintenance Disbursements per Mile | 49 |
| Administrative Disbursements per Mile | 47 |
| Rural Interstate Pavement Condition | 46 |
| Rural Arterial Pavement Condition | 35 |
| Urban Interstate Pavement Condition | 49 |
| Urban Interstate Congestion | 46 |
| Deficient Bridges | 1 |
| Fatality Rate | 9 |
| Narrow Rural Arterial Lanes | 33 |
| Overall Performance | 45 |
Colorado ranks 33rd in the nation in highway performance and cost-effectiveness in the Annual Highway Report by Reason Foundation.
Colorado ranks 17th in fatality rate, 9th in deficient bridges, 43rd in rural Interstate pavement condition, 21 st in urban Interstate pavement condition and 37th in urban Interstate congestion.
On spending, Colorado ranks 29th in total disbursements per mile and 37th in administrative disbursements per mile.
Colorado’s best rankings are deficient bridges (9th), fatality rate (17th) and rural arterial pavement condition (20th).
Colorado’s worst rankings are rural Interstate pavement condition (43rd), maintenance disbursements per mile (37th), administrative disbursements per mile (37th) and urban Interstate congestion (37th).
Colorado’s state-controlled highway mileage makes it the 29th largest system.
Colorado’s Complete Results
Overall Rank in 2012: 33rd
Overall Rank in 2011: 29th
Overall Rank in 2009: 41st
| Performance by Category in 2012 | Ranking |
| Total Disbursements per Mile | 29 |
| Capital and Bridge Disbursements per Mile | 24 |
| Maintenance Disbursements per Mile | 37 |
| Administrative Disbursements per Mile | 37 |
| Rural Interstate Pavement Condition | 43 |
| Rural Arterial Pavement Condition | 20 |
| Urban Interstate Pavement Condition | 21 |
| Urban Interstate Congestion | 37 |
| Deficient Bridges | 9 |
| Fatality Rate | 17 |
| Narrow Rural Arterial Lanes | 31 |
| Overall Performance | 33 |
Connecticut ranks 44th in the nation in highway performance and cost-effectiveness in the Annual Highway Report by Reason Foundation.
Connecticut ranks 3rd in fatality rate, 45th in deficient bridges, 33rd in rural Interstate pavement condition, 33 rd in urban Interstate pavement condition and 23rd in urban Interstate congestion.
On spending, Connecticut ranks 44th in total disbursements per mile and 49th in administrative disbursements per mile.
Connecticut’s best rankings are fatality rate (3rd), narrow rural lanes (11th) and urban Interstate congestion (23rd).
Connecticut’s worst rankings are administrative disbursements per mile (49th) and deficient bridges (45th).
Connecticut’s state-controlled highway mileage makes it the 44th largest system.
Connecticut’s Complete Results
Overall Rank in 2012: 44th
Overall Rank in 2011: 43th
Overall Rank in 2009: 44th
| Performance by Category in 2012 | Ranking |
| Total Disbursements per Mile | 44 |
| Capital and Bridge Disbursements per Mile | 41 |
| Maintenance Disbursements per Mile | 28 |
| Administrative Disbursements per Mile | 49 |
| Rural Interstate Pavement Condition | 33 |
| Rural Arterial Pavement Condition | 45 |
| Urban Interstate Pavement Condition | 33 |
| Urban Interstate Congestion | 23 |
| Deficient Bridges | 45 |
| Fatality Rate | 3 |
| Narrow Rural Arterial Lanes | 11 |
| Overall Performance | 44 |
Delaware ranks 37th in the nation in highway performance and cost-effectiveness in the Annual Highway Report by Reason Foundation.
Delaware ranks 30th in fatality rate, 20th in deficient bridges, 41st in urban Interstate pavement condition and 39 th in urban Interstate congestion. Delaware has no rural Interstate mileage.
On spending, Delaware ranks 40th in total disbursements per mile and 29th in administrative disbursements per mile.
Delaware’s best rankings are narrow rural arterial lanes (1st), deficient bridges (20th) and capital-bridge disbursements per mile (22nd).
Delaware’s worst rankings are maintenance disbursements per mile (44th) and urban Interstate pavement condition (41st).
Delaware’s state-controlled highway mileage makes it the 41st largest system.
Delaware’s Complete Results
Overall Rank in 2012: 37th
Overall Rank in 2011: 35th
Overall Rank in 2009: 20th
| Performance by Category in 2012 | Ranking |
| Total Disbursements per Mile | 40 |
| Capital and Bridge Disbursements per Mile | 22 |
| Maintenance Disbursements per Mile | 44 |
| Administrative Disbursements per Mile | 29 |
| Rural Interstate Pavement Condition | N/A |
| Rural Arterial Pavement Condition | 36 |
| Urban Interstate Pavement Condition | 41 |
| Urban Interstate Congestion | 39 |
| Deficient Bridges | 20 |
| Fatality Rate | 30 |
| Narrow Rural Arterial Lanes | 1 |
| Overall Performance | 37 |
Florida ranks 31th in the nation in highway performance and cost-effectiveness in the Annual Highway Report by Reason Foundation.
Florida ranks 32nd in fatality rate, 11th in deficient bridges, 10th in rural Interstate pavement condition, 16 th in urban Interstate pavement condition and 50th in urban Interstate congestion.
On spending, Florida ranks 48th in total disbursements per mile and 36th in administrative disbursements per mile.
Florida’s best rankings are rural Interstate pavement condition (10th), deficient bridges (11th), narrow rural arterial narrow lanes (12th) and rural arterial pavement condition (12th).
Florida’s worst rankings are urban Interstate congestion (50th) and capital and bridge disbursements per mile (49th).
Florida’s state-controlled highway mileage makes it the 20th largest system.
Florida’s Complete Results
Overall Rank in 2012: 31st
Overall Rank in 2011: 33rd
Overall Rank in 2009: 37th
| Performance by Category in 2012 | Ranking |
| Total Disbursements per Mile | 48 |
| Capital and Bridge Disbursements per Mile | 49 |
| Maintenance Disbursements per Mile | 45 |
| Administrative Disbursements per Mile | 36 |
| Rural Interstate Pavement Condition | 10 |
| Rural Arterial Pavement Condition | 12 |
| Urban Interstate Pavement Condition | 16 |
| Urban Interstate Congestion | 50 |
| Deficient Bridges | 11 |
| Fatality Rate | 32 |
| Narrow Rural Arterial Lanes | 12 |
| Overall Performance | 31 |
Georgia ranks 13th in the nation in highway performance and cost-effectiveness in the Annual Highway Report by Reason Foundation.
Georgia ranks 23rd in fatality rate, 16th in deficient bridges, 1st in rural Interstate pavement condition, 4th in urban Interstate pavement condition and 44th in urban Interstate congestion.
On spending, Georgia ranks 24th in total disbursements per mile and 39th in administrative disbursements per mile.
Georgia’s best rankings are rural Interstate pavement condition (1st), rural arterial pavement condition (2nd) and urban Interstate pavement condition (4th).
Georgia’s worst rankings are urban Interstate congestion (44th) and administrative disbursements per mile (39th).
Georgia’s state-controlled highway mileage makes it the 10th largest system.
Georgia’s Complete Results
Overall Rank in 2012: 13th
Overall Rank in 2011: 11th
Overall Rank in 2009: 12th
| Performance by Category in 2012 | Ranking |
| Total Disbursements per Mile | 24 |
| Capital and Bridge Disbursements per Mile | 16 |
| Maintenance Disbursements per Mile | 11 |
| Administrative Disbursements per Mile | 39 |
| Rural Interstate Pavement Condition | 1 |
| Rural Arterial Pavement Condition | 2 |
| Urban Interstate Pavement Condition | 4 |
| Urban Interstate Congestion | 44 |
| Deficient Bridges | 16 |
| Fatality Rate | 23 |
| Narrow Rural Lanes | 36 |
| Overall Performance | 13 |
Hawaii ranks 50th in the nation in highway performance and cost-effectiveness in the Annual Highway Report by Reason Foundation.
Hawaii ranks 31st in fatality rate, 46th in deficient bridges, 49th in rural Interstate pavement condition, 50 th in urban Interstate pavement condition and 49th in urban Interstate congestion.
On spending, Hawaii ranks 42nd in total disbursements per mile and 50th in administrative disbursements per mile.
Hawaii’s best rankings are fatality rate (31th), maintenance disbursements per mile (40th) and total disbursements per mile (42 nd).
Hawaii’s worst rankings are administrative disbursements per mile (50th) and urban Interstate pavement condition (50th).
Hawaii’s state-controlled highway mileage makes it the 50th largest system.
Hawaii’s Complete Results
Overall Rank in 2012: 50th
Overall Rank in 2011: 49th
Overall Rank in 2009: 48th
| Performance by Category in 2012 | Ranking |
| Total Disbursements per Mile | 42 |
| Capital and Bridge Disbursements per Mile | 46 |
| Maintenance Disbursements per Mile | 40 |
| Administrative Disbursements per Mile | 50 |
| Rural Interstate Pavement Condition | 49 |
| Rural Arterial Pavement Condition | 49 |
| Urban Interstate Pavement Condition | 50 |
| Urban Interstate Congestion | 49 |
| Deficient Bridges | 46 |
| Fatality Rate | 31 |
| Narrow Rural Lanes | 46 |
| Overall Performance | 50 |
Idaho ranks 30th in the nation in highway performance and cost-effectiveness in the Annual Highway Report by Reason Foundation.
Idaho ranks 24th in fatality rate, 17th in deficient bridges, 42nd in rural Interstate pavement condition, 36th in urban Interstate pavement condition and 35th in urban Interstate congestion.
On spending, Idaho ranks 17th in total disbursements per mile and 14th in administrative disbursements per mile.
Idaho’s best rankings are percent narrow rural lanes (13th), administrative disbursements per mile (14th), total disbursements per mile (17 th) and deficient bridges (17 th).
Idaho’s worst rankings are rural Interstate pavement condition (42nd) and rural arterial pavement condition (42nd).
Idaho’s state-controlled highway mileage makes it the 43rd largest system.
Idaho’s Complete Results
Overall Rank in 2012: 30th
Overall Rank in 2011: 8th
Overall Rank in 2009: 17th
| Performance by Category in 2012 | Ranking |
| Total Disbursements per Mile | 17 |
| Capital and Bridge Disbursements per Mile | 19 |
| Maintenance Disbursements per Mile | 20 |
| Administrative Disbursements per Mile | 14 |
| Rural Interstate Pavement Condition | 42 |
| Rural Arterial Pavement Condition | 42 |
| Urban Interstate Pavement Condition | 36 |
| Urban Interstate Congestion | 35 |
| Deficient Bridges | 17 |
| Fatality Rate | 24 |
| Narrow Rural Arterial Lanes | 13 |
| Overall Performance | 30 |
Illinois ranks 27th in the nation in highway performance and cost-effectiveness in the Annual Highway Report by Reason Foundation.
Illinois ranks 12th in fatality rate, 10th in deficient bridges, 1st in rural Interstate pavement condition, 3rd in urban Interstate pavement condition and 47th in urban Interstate congestion.
On spending, Illinois ranks 38th in total disbursements per mile and 34th in administrative disbursements per mile.
Illinois’s best rankings are rural Interstate pavement condition (1st), urban Interstate pavement condition (3rd) and deficient bridges (10th).
Illinois’s worst rankings are urban Interstate congestion (47th) and capital-bridge disbursements per mile (43rd).
Illinois’s state-controlled highway mileage makes it the 13th largest system.
Illinois’s Complete Results
Overall Rank in 2012: 27th
Overall Rank in 2011: 30th
Overall Rank in 2009: 34th
| Performance by Category in 2012 | Ranking |
| Total Disbursements per Mile | 38 |
| Capital and Bridge Disbursements per Mile | 43 |
| Maintenance Disbursements per Mile | 36 |
| Administrative Disbursements per Mile | 34 |
| Rural Interstate Pavement Condition | 1 |
| Rural Arterial Pavement Condition | 15 |
| Urban Interstate Pavement Condition | 3 |
| Urban Interstate Congestion | 47 |
| Deficient Bridges | 10 |
| Fatality Rate | 12 |
| Narrow Rural Arterial Lanes | 35 |
| Overall Performance | 27 |
Indiana ranks 36th in the nation in highway performance and cost-effectiveness in the Annual Highway Report by Reason Foundation.
Indiana ranks 14th in fatality rate, 24th in deficient bridges, 45th in rural Interstate pavement condition, 39 th in urban Interstate pavement condition and 43rd in urban Interstate congestion.
On spending, Indiana ranks 33rd in total disbursements per mile and 20th in administrative disbursements per mile.
Indiana’s best rankings are fatality rate (14th), administrative disbursements per mile (20th) and deficient bridges (24th ).
Indiana’s worst rankings are rural Interstate pavement condition (45th) and urban Interstate congestion (43rd).
Indiana’s state-controlled highway mileage makes it the 24th largest system.
Indiana’s Complete Results
Overall Rank in 2012: 36th
Overall Rank in 2011: 41st
Overall Rank in 2009: 22nd
| Performance by Category in 2012 | Ranking |
| Total Disbursements per Mile | 33 |
| Capital and Bridge Disbursements per Mile | 38 |
| Maintenance Disbursements per Mile | 39 |
| Administrative Disbursements per Mile | 20 |
| Rural Interstate Pavement Condition | 45 |
| Rural Arterial Pavement Condition | 39 |
| Urban Interstate Pavement Condition | 39 |
| Urban Interstate Congestion | 43 |
| Deficient Bridges | 24 |
| Fatality Rate | 14 |
| Narrow Rural Arterial Lanes | 32 |
| Overall Performance | 36 |
Iowa ranks 18th in the nation in highway performance and cost-effectiveness in the Annual Highway Report by Reason Foundation.
Iowa ranks 26th in fatality rate, 35th in deficient bridges, 17th in rural Interstate pavement condition, 37th in urban Interstate pavement condition and 32nd in urban Interstate congestion.
On spending, Iowa ranks 20th in total disbursements per mile and 15th in administrative disbursements per mile.
Iowa’s best rankings are administrative disbursements per mile (15th), rural Interstate pavement condition (17th) and total disbursements per mile (20th).
Iowa’s worst rankings are rural arterial pavement condition (40th) and urban Interstate pavement condition (37th).
Iowa’s state-controlled highway mileage makes it the 31st largest system.
Iowa’s Complete Results
Overall Rank in 2012: 18th
Overall Rank in 2011: 12th
Overall Rank in 2009: 33rd
| Performance by Category in 2012 | Ranking |
| Total Disbursements per Mile | 20 |
| Capital and Bridge Disbursements per Mile | 28 |
| Maintenance Disbursements per Mile | 25 |
| Administrative Disbursements per Mile | 15 |
| Rural Interstate Pavement Condition | 17 |
| Rural Arterial Pavement Condition | 40 |
| Urban Interstate Pavement Condition | 37 |
| Urban Interstate Congestion | 32 |
| Deficient Bridges | 35 |
| Fatality Rate | 26 |
| Narrow Rural Arterial Lanes | 25 |
| Overall Performance | 18 |
Kansas ranks 5th in the nation in highway performance and cost-effectiveness in the Annual Highway Report by Reason Foundation.
Kansas ranks 33rd in fatality rate, 15th in deficient bridges, 1st in rural Interstate pavement condition, 11th in urban Interstate pavement condition and 3rd in urban Interstate congestion.
On spending, Kansas ranks 27th in total disbursements per mile and 17th in administrative disbursements per mile.
Kansas’s best rankings are rural Interstate pavement condition (1st), urban Interstate congestion (3rd) and rural arterial pavement condition (5th).
Kansas’s worst rankings are fatality rate (33rd) and total disbursements per mile (27th).
Kansas’s state-controlled highway mileage makes it the 27th largest system.
Kansas’s Complete Results
Overall Rank in 2012: 5th
Overall Rank in 2011: 3rd
Overall Rank in 2009: 2nd
| Performance by Category in 2012 | Ranking |
| Total Disbursements per Mile | 27 |
| Capital and Bridge Disbursements per Mile | 27 |
| Maintenance Disbursements per Mile | 14 |
| Administrative Disbursements per Mile | 17 |
| Rural Interstate Pavement Condition | 1 |
| Rural Arterial Pavement Condition | 5 |
| Urban Interstate Pavement Condition | 11 |
| Urban Interstate Congestion | 3 |
| Deficient Bridges | 15 |
| Fatality Rate | 33 |
| Narrow Rural Arterial Lanes | 10 |
| Overall Performance | 5 |
Kentucky ranks 10th in the nation in highway performance and cost-effectiveness in the Annual Highway Report by Reason Foundation.
Kentucky ranks 45th in fatality rate, 42nd in deficient bridges, 22nd in rural Interstate pavement condition, 14 th in urban Interstate pavement condition and 25th in urban Interstate congestion.
On spending, Kentucky ranks 8th in total disbursements per mile and 1st in administrative disbursements per mile.
Kentucky’s best rankings are administrative disbursements per mile (1st), total disbursements per mile (8th) and capital-bridge disbursements per mile (11th).
Kentucky’s worst rankings are fatality rate (45th) and deficient bridges (42nd).
Kentucky’s state-controlled highway mileage makes it the 8th largest system.
Kentucky’s Complete Results
Overall Rank in 2012: 10th
Overall Rank in 2011: 26th
Overall Rank in 2009: 14th
| Performance by Category in 2012 | Ranking |
| Total Disbursements per Mile | 8 |
| Capital and Bridge Disbursements per Mile | 11 |
| Maintenance Disbursements per Mile | 15 |
| Administrative Disbursements per Mile | 1 |
| Rural Interstate Pavement Condition | 22 |
| Rural Arterial Pavement Condition | 17 |
| Urban Interstate Pavement Condition | 14 |
| Urban Interstate Congestion | 25 |
| Deficient Bridges | 42 |
| Fatality Rate | 45 |
| Narrow Rural Arterial Lanes | 38 |
| Overall Performance | 10 |
Louisiana ranks 40th in the nation in highway performance and cost-effectiveness in the Annual Highway Report by Reason Foundation.
Louisiana ranks 44th in fatality rate, 39th in deficient bridges, 41st in rural Interstate pavement condition, 48th in urban Interstate pavement condition and 19th in urban Interstate congestion.
On spending, Louisiana ranks 25th in total disbursements per mile and 19th in administrative costs per mile.
Louisiana’s best rankings are maintenance disbursements per mile (8th), administrative disbursements per mile (19th) and urban Interstate congestion (19th).
Louisiana’s worst rankings are urban Interstate pavement condition (48th) fatality rate (44th) and rural arterial pavement condition (44th).
Louisiana’s state-controlled highway mileage makes it the 14th largest system.
Louisiana’s Complete Results
Overall Rank in 2012: 40th
Overall Rank in 2011: 24th
Overall Rank in 2009: 35th
| Performance by Category in 2012 | Ranking |
| Total Disbursements per Mile | 25 |
| Capital and Bridge Disbursements per Mile | 23 |
| Maintenance Disbursements per Mile | 8 |
| Administrative Disbursements per Mile | 19 |
| Rural Interstate Pavement Condition | 41 |
| Rural Arterial Pavement Condition | 44 |
| Urban Interstate Pavement Condition | 48 |
| Urban Interstate Congestion | 19 |
| Deficient Bridges | 39 |
| Fatality Rate | 44 |
| Narrow Rural Arterial Lanes | 21 |
| Overall Performance | 40 |
Maine ranks 16th in the nation in highway performance and cost-effectiveness in the Annual Highway Report by Reason Foundation.
Maine ranks 25th in fatality rate, 38th in deficient bridges, 14th in rural Interstate pavement condition, 7th in urban Interstate pavement condition and 17th in urban Interstate congestion.
On spending, Maine ranks 13th in total disbursements per mile and 4th in administrative disbursements mile.
Maine’s best rankings are administrative disbursements per mile (4th), urban Interstate pavement condition (7th) and capital-bridge disbursements per mile (9th).
Maine’s worst rankings are narrow rural arterial lanes (45th) and deficient bridges (38th).
Maine’s state-controlled highway mileage makes it the 33rd largest system.
Maine’s Complete Results
Overall Rank in 2012: 16th
Overall Rank in 2011: 18th
Overall Rank in 2009: 29th
| Performance by Category in 2012 | Ranking |
| Total Disbursements per Mile | 13 |
| Capital and Bridge Disbursements per Mile | 9 |
| Maintenance Disbursements per Mile | 27 |
| Administrative Disbursements per Mile | 4 |
| Rural Interstate Pavement Condition | 14 |
| Rural Arterial Pavement Condition | 14 |
| Urban Interstate Pavement Condition | 7 |
| Urban Interstate Congestion | 17 |
| Deficient Bridges | 38 |
| Fatality Rate | 25 |
| Narrow Rural Arterial Lanes | 45 |
| Overall Performance | 16 |
Maryland ranks 39th in the nation in highway performance and cost-effectiveness in the Annual Highway Report by Reason Foundation.
Maryland ranks 10th in fatality rate, 33rd in deficient bridges, 27th in rural Interstate pavement condition, 44 th in urban Interstate pavement condition and 48th in urban Interstate congestion.
On spending, Maryland ranks 45th in total disbursements per mile and 31st in administrative disbursements per mile.
Maryland’s best rankings are fatality rate (10th), narrow rural arterial lanes (14th) and rural arterial pavement condition (22 nd).
Maryland’s worst rankings are urban Interstate congestion (48th) and maintenance disbursements per mile (48th).
Maryland’s state-controlled highway mileage makes it the 42nd largest system.
Maryland’s Complete Results
Overall Rank in 2012: 39th
Overall Rank in 2011: 38th
Overall Rank in 2009: 40th
| Performance by Category in 2012 | Ranking |
| Total Disbursements per Mile | 45 |
| Capital and Bridge Disbursements per Mile | 42 |
| Maintenance Disbursements per Mile | 48 |
| Administrative Disbursements per Mile | 31 |
| Rural Interstate Pavement Condition | 27 |
| Rural Arterial Pavement Condition | 22 |
| Urban Interstate Pavement Condition | 44 |
| Urban Interstate Congestion | 48 |
| Deficient Bridges | 33 |
| Fatality Rate | 10 |
| Narrow Rural Arterial Lanes | 14 |
| Overall Performance | 39 |
Massachusetts ranks 46th in the nation in highway performance and cost-effectiveness in the Annual Highway Report by Reason Foundation.
Massachusetts ranks 1st in fatality rate, 47th in deficient bridges, 39th in rural Interstate pavement condition, 34 th in urban Interstate pavement condition and 28th in urban Interstate congestion.
On spending, Massachusetts ranks 49th in total disbursements per mile and 48th in administrative disbursements per mile.
Massachusetts’s best rankings are fatality rate (1st), urban Interstate congestion (28th) and narrow rural arterial lanes (30th).
Massachusetts’s worst rankings are total disbursements per mile (49th), administrative disbursements per mile (48th) and capital bridge disbursements per mile (48th).
Massachusetts’s state-controlled highway mileage makes it the 46th largest system.
Massachusetts’s Complete Results
Overall Rank in 2012: 46th
Overall Rank in 2011: 45th
Overall Rank in 2009: 43rd
| Performance by Category in 2012 | Ranking |
| Total Disbursements per Mile | 49 |
| Capital and Bridge Disbursements per Mile | 48 |
| Maintenance Disbursements per Mile | 46 |
| Administrative Disbursements per Mile | 48 |
| Rural Interstate Pavement Condition | 39 |
| Rural Arterial Pavement Condition | 47 |
| Urban Interstate Pavement Condition | 34 |
| Urban Interstate Congestion | 28 |
| Deficient Bridges | 47 |
| Fatality Rate | 1 |
| Narrow Rural Arterial Lanes | 30 |
| Overall Performance | 46 |
Michigan ranks 32nd in the nation in highway performance and cost-effectiveness in the Annual Highway Report by Reason Foundation.
Michigan ranks 15th in fatality rate, 31st in deficient bridges, 40th in rural Interstate pavement condition, 38 th in urban Interstate pavement condition and 26th in urban Interstate congestion.
On spending, Michigan ranks 31st in total disbursements per mile and 22nd in administrative disbursements per mile.
Michigan’s best rankings are fatality rate (15th), rural arterial pavement condition (19th) and administrative disbursements per mile (22nd).
Michigan’s worst rankings are rural Interstate pavement condition (40th) and urban Interstate pavement condition (38th).
Michigan’s state-controlled highway mileage makes it the 30th largest system.
Michigan’s Complete Results
Overall Rank in 2012: 32nd
Overall Rank in 2011: 36th
Overall Rank in 2009: 30th
| Performance by Category in 2012 | Ranking |
| Total Disbursements per Mile | 31 |
| Capital and Bridge Disbursements per Mile | 34 |
| Maintenance Disbursements per Mile | 31 |
| Administrative Disbursements per Mile | 22 |
| Rural Interstate Pavement Condition | 40 |
| Rural Arterial Pavement Condition | 19 |
| Urban Interstate Pavement Condition | 38 |
| Urban Interstate Congestion | 26 |
| Deficient Bridges | 31 |
| Fatality Rate | 15 |
| Narrow Rural Arterial Lanes | 37 |
| Overall Performance | 32 |
Minnesota ranks 28th in the nation in highway performance and cost-effectiveness in the Annual Highway Report by Reason Foundation.
Minnesota ranks 2nd in fatality rate, 5th in deficient bridges, 37th in rural Interstate pavement condition, 43 rd in urban Interstate pavement condition and 24th in urban Interstate congestion.
On spending, Minnesota ranks 19th in total disbursements per mile and 26th in administrative disbursements per mile.
Minnesota’s best rankings are fatality rate (2nd), deficient bridges (5th) and narrow rural arterial lanes (6th).
Minnesota’s worst rankings are rural arterial pavement condition (43rd) and urban Interstate pavement condition (43rd)
Minnesota’s state-controlled highway mileage makes it the 18th largest system.
Minnesota’s Complete Results
Overall Rank in 2012: 28th
Overall Rank in 2011: 31st
Overall Rank in 2009: 42nd
| Performance by Category in 2012 | Ranking |
| Total Disbursements per Mile | 19 |
| Capital and Bridge Disbursements per Mile | 17 |
| Maintenance Disbursements per Mile | 30 |
| Administrative Disbursements per Mile | 26 |
| Rural Interstate Pavement Condition | 37 |
| Rural Arterial Pavement Condition | 43 |
| Urban Interstate Pavement Condition | 43 |
| Urban Interstate Congestion | 24 |
| Deficient Bridges | 5 |
| Fatality Rate | 2 |
| Narrow Rural Arterial Lanes | 6 |
| Overall Performance | 28 |
Mississippi ranks 8th in the nation in highway performance and cost-effectiveness in the Annual Highway Report by Reason Foundation.
Mississippi ranks 43rd in fatality rate, 21st in deficient bridges, 30th in rural Interstate pavement condition, 6 th in urban Interstate pavement condition and 2nd in urban Interstate congestion.
On spending, Mississippi ranks 15th in total disbursements per mile and 16th in administrative disbursements per mile.
Mississippi’s best rankings are urban Interstate congestion (2nd), maintenance disbursements per mile (5th) and urban Interstate pavement condition (6th).
Mississippi’s worst rankings are fatality rate (43rd) and rural Interstate pavement condition (30th).
Mississippi’s state-controlled highway mileage makes it the 26th largest system.
Mississippi’s Complete Results
Overall Rank in 2012: 8th
Overall Rank in 2011: 10th
Overall Rank in 2009: 10th
| Performance by Category in 2012 | Ranking |
| Total Disbursements per Mile | 15 |
| Capital and Bridge Disbursements per Mile | 18 |
| Maintenance Disbursements per Mile | 5 |
| Administrative Disbursements per Mile | 16 |
| Rural Interstate Pavement Condition | 30 |
| Rural Arterial Pavement Condition | 7 |
| Urban Interstate Pavement Condition | 6 |
| Urban Interstate Congestion | 2 |
| Deficient Bridges | 21 |
| Fatality Rate | 43 |
| Narrow Rural Arterial Lanes | 28 |
| Overall Performance | 8 |
Missouri ranks 12th in the nation in highway performance and cost-effectiveness in the Annual Highway Report by Reason Foundation.
Missouri ranks 27th in fatality rate, 34th in deficient bridges, 23rd in rural Interstate pavement condition, 24 th in urban Interstate pavement condition and 4th in urban Interstate congestion.
On spending, Missouri ranks 6th in total disbursements per mile and 2nd in administrative disbursements per mile.
Missouri’s best rankings are administrative disbursements per mile (2nd), urban Interstate congestion (4th) and capital-bridge disbursements per mile (5th).
Missouri’s worst rankings are narrow rural arterial lanes (39th) and deficient bridges (34th).
Missouri’s state-controlled highway mileage makes it the 7th largest system.
Missouri’s Complete Results
Overall Rank in 2012: 12th
Overall Rank in 2011: 13th
Overall Rank in 2009: 8th
| Performance by Category in 2012 | Ranking |
| Total Disbursements per Mile | 6 |
| Capital and Bridge Disbursements per Mile | 5 |
| Maintenance Disbursements per Mile | 13 |
| Administrative Disbursements per Mile | 2 |
| Rural Interstate Pavement Condition | 23 |
| Rural Arterial Pavement Condition | 21 |
| Urban Interstate Pavement Condition | 24 |
| Urban Interstate Congestion | 4 |
| Deficient Bridges | 34 |
| Fatality Rate | 27 |
| Narrow Rural Arterial Lanes | 39 |
| Overall Performance | 12 |
Montana ranks 9th in the nation in highway performance and cost-effectiveness in the Annual Highway Report by Reason Foundation.
Montana ranks 48th in fatality rate, 13th in deficient bridges, 28th in rural Interstate pavement condition, 18 th in urban Interstate pavement condition and 7th in urban Interstate congestion.
On spending, Montana ranks 10th in total disbursements per mile and 10th in administrative disbursements per mile.
Montana’s best rankings are urban Interstate congestion (7th), capital and bridge disbursements per mile (10th), administrative disbursements per mile (10th) and total disbursements per mile (10th).
Montana’s worst rankings are fatality rate (48th) and rural arterial pavement condition (37th).
Montana’s state-controlled highway mileage makes it the 23rd largest system.
Montana’s Complete Results
Overall Rank in 2012: 9th
Overall Rank in 2011: 9th
Overall Rank in 2009: 5th
| Performance by Category in 2012 | Ranking |
| Total Disbursements per Mile | 10 |
| Capital and Bridge Disbursements per Mile | 10 |
| Maintenance Disbursements per Mile | 12 |
| Administrative Disbursements per Mile | 10 |
| Rural Interstate Pavement Condition | 28 |
| Rural Arterial Pavement Condition | 37 |
| Urban Interstate Pavement Condition | 18 |
| Urban Interstate Pavement Congestion | 7 |
| Deficient Bridges | 13 |
| Fatality Rate | 48 |
| Narrow Rural Arterial Lanes | 16 |
| Overall Performance | 9 |
Nebraska ranks 2nd in the nation in highway performance and cost-effectiveness in the Annual Highway Report by Reason Foundation.
Nebraska ranks 22nd in fatality rate, 28th in deficient bridges, 1st in rural Interstate pavement condition, 9 th in urban Interstate pavement condition and 12th in urban Interstate congestion.
On spending, Nebraska ranks 5th in total disbursements per mile and 5th in administrative disbursements per mile.
Nebraska’s best rankings are rural Interstate pavement condition (1st), administrative disbursements per mile, (5th) and total disbursements per mile (5th).
Nebraska’s worst rankings are rural arterial pavement condition (30th) and deficient bridges (28th).
Nebraska’s state-controlled highway mileage makes it the 28th largest system.
Nebraska’s Complete Results
Overall Rank in 2012: 2nd
Overall Rank in 2011: 2nd
Overall Rank in 2009: 6th
| Performance by Category in 2012 | Ranking |
| Total Disbursements per Mile | 5 |
| Capital and Bridge Disbursements per Mile | 8 |
| Maintenance Disbursements per Mile | 17 |
| Administrative Disbursements per Mile | 5 |
| Rural Interstate Pavement Condition | 1 |
| Rural Arterial Pavement Condition | 30 |
| Urban Interstate Pavement Condition | 9 |
| Urban Interstate Congestion | 12 |
| Deficient Bridges | 28 |
| Fatality Rate | 22 |
| Narrow Rural Arterial Lanes | 7 |
| Overall Performance | 2 |
Nevada ranks 24th in the nation in highway performance and cost-effectiveness in the Annual Highway Report by Reason Foundation.
Nevada ranks 21st in fatality rate, 3rd in deficient bridges, 29th in rural Interstate pavement condition, 26th in urban Interstate pavement condition and 45th in urban Interstate congestion.
On spending, Nevada ranks 35st in total disbursements per mile and 41st in administrative disbursements per mile.
Nevada’s best rankings are rural arterial pavement condition (3rd), deficient bridges (3rd) and fatality rate (21st).
Nevada’s worst rankings are urban Interstate congestion (45th) and administrative disbursements per mile (41st).
Nevada’s state-controlled highway mileage makes it the 40th largest system.
Nevada’s Complete Results
Overall Rank in 2012: 24th
Overall Rank in 2011: 16th
Overall Rank in 2009: 16th
| Performance by Category in 2012 | Ranking |
| Total Disbursements per Mile | 35 |
| Capital and Bridge Disbursements per Mile | 36 |
| Maintenance Disbursements per Mile | 26 |
| Administrative Disbursements per Mile | 41 |
| Rural Interstate Pavement Condition | 29 |
| Rural Arterial Pavement Condition | 3 |
| Urban Interstate Pavement Condition | 26 |
| Urban Interstate Congestion | 45 |
| Deficient Bridges | 3 |
| Fatality Rate | 21 |
| Narrow Rural Arterial Lanes | 26 |
| Overall Performance | 24 |
New Hampshire ranks 23rd in the nation in highway performance and cost-effectiveness in the Annual Highway Report by Reason Foundation.
New Hampshire ranks 8th in fatality rate, 40th in deficient bridges, 35th in rural Interstate pavement condition, 1 st in urban Interstate pavement condition and 13th in urban Interstate congestion.
On spending, New Hampshire ranks 30th in total disbursements per mile and 42nd in administrative disbursements per mile.
New Hampshire’s best rankings are urban Interstate pavement condition (1st), rural arterial narrow lanes (1st) and fatality rate (8 th).
New Hampshire’s worst rankings are administrative disbursements per mile (42nd) and deficient bridges (40th).
New Hampshire’s state-controlled highway mileage makes it the 45th largest system.
New Hampshire’s Complete Results
Overall Rank in 2012: 23rd
Overall Rank in 2011: 23rd
Overall Rank in 2009: 18th
| Performance by Category in 2012 | Ranking |
| Total Disbursements per Mile | 30 |
| Capital and Bridge Disbursements per Mile | 20 |
| Maintenance Disbursements per Mile | 22 |
| Administrative Disbursements per Mile | 42 |
| Rural Interstate Pavement Condition | 35 |
| Rural Arterial Pavement Condition | 13 |
| Urban Interstate Pavement Condition | 1 |
| Urban Interstate Congestion | 13 |
| Deficient Bridges | 40 |
| Fatality Rate | 8 |
| Narrow Rural Arterial Lanes | 1 |
| Overall Performance | 23 |
New Jersey ranks 48th in the nation in highway performance and cost-effectiveness in the Annual Highway Report by Reason Foundation.
New Jersey ranks 5th in fatality rate, 36th in deficient bridges, 31st in rural Interstate pavement condition, 46 th in urban Interstate pavement condition and 41st in urban Interstate congestion.
On spending, New Jersey ranks 50th in total disbursements per mile and 45th in administrative disbursements per mile.
New Jersey’s best rankings are fatality rate (5th), narrow rural arterial lanes (19th) and rural Interstate pavement condition (31st).
New Jersey’s worst rankings are total disbursements per mile (50th), maintenance disbursements per mile (50th) and capital-bridge disbursements per mile (50th).
New Jersey’s state-controlled highway mileage makes it the 47th largest system.
New Jersey’s Complete Results
Overall Rank in 2012: 48th
Overall Rank in 2011: 47th
Overall Rank in 2009: 46th
| Performance by Category in 2012 | Ranking |
| Total Disbursements per Mile | 50 |
| Capital and Bridge Disbursements per Mile | 50 |
| Maintenance Disbursements per Mile | 50 |
| Administrative Disbursements per Mile | 45 |
| Rural Interstate Pavement Condition | 31 |
| Rural Arterial Pavement Condition | 46 |
| Urban Interstate Pavement Condition | 46 |
| Urban Interstate Congestion | 41 |
| Deficient Bridges | 36 |
| Fatality Rate | 5 |
| Narrow Rural Arterial Lanes | 19 |
| Overall Performance | 48 |
New Mexico ranks 7th in the nation in highway performance and cost-effectiveness in the Annual Highway Report by Reason Foundation.
New Mexico ranks 39th in fatality rate, 8th in deficient bridges, 11th in rural Interstate pavement condition, 12 th in urban Interstate pavement condition and 10th in urban Interstate congestion.
On spending, New Mexico ranks 11th in total disbursements per mile and 40th in administrative disbursements per mile.
New Mexico’s best rankings are maintenance disbursements per mile (1st), capital-bridge disbursements per mile (6th) and rural arterial pavement condition (6th).
New Mexico’s worst rankings are administrative disbursements per mile (40th) and fatality rate (39th).
New Mexico’s state-controlled highway mileage makes it the 21th largest system.
New Mexico’s Complete Results
Overall Rank in 2012: 7th
Overall Rank in 2011: 6th
Overall Rank in 2009: 4th
| Performance by Category in 2012 | Ranking |
| Total Disbursements Per Mile | 11 |
| Capital and Bridge Disbursements per Mile | 6 |
| Maintenance Disbursements per Mile | 1 |
| Administrative Disbursements per Mile | 40 |
| Rural Interstate Pavement Condition | 11 |
| Rural Arterial Pavement Condition | 6 |
| Urban Interstate Pavement Condition | 12 |
| Urban Interstate Congestion | 10 |
| Deficient Bridges | 8 |
| Fatality Rate | 39 |
| Narrow Rural Arterial Lanes | 22 |
| Overall Performance | 7 |
New York ranks 43rd in the nation in highway performance and cost-effectiveness in the Annual Highway Report by Reason Foundation.
New York ranks 11th in fatality rate, 49th in deficient bridges, 38th in rural Interstate pavement condition, 45 th in urban Interstate pavement condition and 36th in urban Interstate congestion.
On spending, New York ranks 43rd in total disbursements per mile and 38th in administrative disbursements per mile.
New York’s best rankings are fatality rate (11th), rural arterial pavement condition (28th) and urban Interstate congestion (36 th).
New York’s worst rankings are deficient bridges (49th) and maintenance disbursements per mile (47th).
New York’s state-controlled highway mileage makes it the 15th largest system.
New York’s Complete Results
Overall Rank in 2012: 43rd
Overall Rank in 2011: 44th
Overall Rank in 2009: 45th
| Performance by Category in 2012 | Ranking |
| Total Disbursements per Mile | 43 |
| Capital and Bridge Disbursements per Mile | 39 |
| Maintenance Disbursements per Mile | 47 |
| Administrative Disbursements per Mile | 38 |
| Rural Interstate Pavement Condition | 38 |
| Rural Arterial Pavement Condition | 28 |
| Urban Interstate Pavement Condition | 45 |
| Urban Interstate Congestion | 36 |
| Deficient Bridges | 49 |
| Fatality Rate | 11 |
| Narrow Rural Arterial Lanes | 43 |
| Overall Performance | 43 |
North Carolina ranks 20th in the nation in highway performance and cost-effectiveness in the Annual Highway Report by Reason Foundation.
North Carolina ranks 28th in fatality rate, 43rd in deficient bridges, 34th in rural Interstate pavement condition, 22 nd in urban Interstate pavement condition and 22nd in urban Interstate congestion.
On spending, North Carolina ranks 3rd in total disbursements per mile and 11th in administrative disbursements per mile.
North Carolina’s best rankings are total disbursements per mile (3rd), capital-bridge disbursements per mile (4th), and maintenance disbursements per mile (6th).
North Carolina’s worst rankings are deficient bridges (43rd) and narrow rural arterial lanes (40th).
North Carolina’s state-controlled highway mileage makes it the 2nd largest system.
North Carolina’s Complete Results
Overall Rank in 2012: 20th
Overall Rank in 2011: 17th
Overall Rank in 2009: 19th
| Performance by Category in 2012 | Ranking |
| Total Disbursements per Mile | 3 |
| Capital and Bridge Disbursements per Mile | 4 |
| Maintenance Disbursements per Mile | 6 |
| Administrative Disbursements per Mile | 11 |
| Rural Interstate Pavement Condition | 34 |
| Rural Arterial Pavement Condition | 29 |
| Urban Interstate Pavement Condition | 22 |
| Urban Interstate Congestion | 22 |
| Deficient Bridges | 43 |
| Fatality Rate | 28 |
| Narrow Rural Arterial Lanes | 40 |
| Overall Performance | 20 |
North Dakota ranks 6th in the nation in highway performance and cost-effectiveness in the Annual Highway Report by Reason Foundation.
North Dakota ranks 47th in fatality rate, 19th in deficient bridges, 1st in rural Interstate pavement condition, 1 st in urban Interstate pavement condition and 15th in urban Interstate congestion.
On spending, North Dakota ranks 14th in total disbursements per mile and 7th in administrative disbursements per mile.
North Dakota’s best rankings are rural Interstate pavement condition (1st), urban Interstate pavement condition (1st) and maintenance disbursements per mile (2nd).
North Dakota’s worst rankings are fatality rate (47th) and capital-bridge disbursements per mile (25th).
North Dakota’s state-controlled highway mileage makes it the 37th largest system.
North Dakota’s Complete Results
Overall Rank in 2012: 6th
Overall Rank in 2011: 7th
Overall Rank in 2009: 1st
| Performance by Category in 2012 | Ranking |
| Total Disbursements per Mile | 14 |
| Capital and Bridge Disbursements per Mile | 25 |
| Maintenance Disbursements per Mile | 2 |
| Administrative Disbursements per Mile | 7 |
| Rural Interstate Pavement Condition | 1 |
| Rural Arterial Pavement Condition | 25 |
| Urban Interstate Pavement Condition | 1 |
| Urban Interstate Congestion | 15 |
| Deficient Bridges | 19 |
| Fatality Rate | 47 |
| Narrow Rural Arterial Lanes | 9 |
| Overall Performance | 6 |
Ohio ranks 14th in the nation in highway performance and cost-effectiveness in the Annual Highway Report by Reason Foundation.
Ohio ranks 16th in fatality rate, 25th in deficient bridges, 18th in rural Interstate pavement condition, 29th in urban Interstate pavement condition and 14th in urban Interstate congestion.
On spending, Ohio ranks 28th in total disbursements per mile and 28th in administrative disbursements per mile.
Ohio’s best rankings are rural arterial pavement condition (11th), urban Interstate congestion (14th) and fatality rate (16 th).
Ohio’s worst rankings are narrow rural arterial lanes (34th) and capital and bridge disbursements per mile (33rd).
Ohio’s state-controlled highway mileage makes it the 9th largest system.
Ohio’s Complete Results
Overall Rank in 2012: 14th
Overall Rank in 2011: 19th
Overall Rank in 2009: 25th
| Performance by Category in 2012 | Ranking |
| Total Disbursements per Mile | 28 |
| Capital and Bridge Disbursements per Mile | 33 |
| Maintenance Disbursements per Mile | 23 |
| Administrative Disbursements per Mile | 28 |
| Rural Interstate Pavement Condition | 18 |
| Rural Arterial Pavement Condition | 11 |
| Urban Interstate Pavement Condition | 29 |
| Urban Interstate Congestion | 14 |
| Deficient Bridges | 25 |
| Fatality Rate | 16 |
| Narrow Rural Arterial Lanes | 34 |
| Overall Performance | 14 |
Oklahoma ranks 22nd in the nation in highway performance and cost-effectiveness in the Annual Highway Report by Reason Foundation.
Oklahoma ranks 42nd in fatality rate,]30th in deficient bridges, 19th in rural Interstate pavement condition, 40 th in urban Interstate pavement condition and 20th in urban Interstate congestion.
On spending, Oklahoma ranks 22nd in total disbursements per mile and 27th in administrative costs per mile of state highway.
Oklahoma’s best rankings are maintenance disbursements per mile (16th), rural Interstate pavement condition (19th) and urban Interstate congestion (20th).
Oklahoma’s worst rankings are fatality rate (42nd) and urban Interstate pavement condition (40th).
Oklahoma’s state-controlled highway mileage makes it the 19th largest system.
Oklahoma’s Complete Results
Overall Rank in 2012: 22nd
Overall Rank in 2011: 32nd
Overall Rank in 2009: 38th
| Performance by Category in 2012 | Ranking |
| Total Disbursements per Mile | 22 |
| Capital and Bridge Disbursements per Mile | 31 |
| Maintenance Disbursements per Mile | 16 |
| Administrative Disbursements per Mile | 27 |
| Rural Interstate Pavement Condition | 19 |
| Rural Arterial Pavement Condition | 26 |
| Urban Interstate Pavement Condition | 40 |
| Urban Interstate Congestion | 20 |
| Deficient Bridges | 30 |
| Fatality Rate | 42 |
| Narrow Rural Arterial Lanes | 24 |
| Overall Performance | 22 |
Oregon ranks 26th in the nation in highway performance and cost-effectiveness in the Annual Highway Report by Reason Foundation.
Oregon ranks 18th in fatality rate, 27th in deficient bridges, 25th in rural Interstate pavement condition, 31 st in urban Interstate pavement condition and 30th in urban Interstate congestion.
On spending, Oregon ranks 32nd in total disbursements per mile and 33rd in administrative disbursements per mile.
Oregon’s best rankings are capital-bridge disbursements per mile (15th), narrow rural arterial lanes (18th) and fatality rate (18 th).
Oregon’s worst rankings are maintenance disbursements per mile (35th) and administrative disbursements per mile (33rd).
Oregon’s state-controlled highway mileage makes it the 34th largest system.
Oregon’s Complete Results
Overall Rank in 2012: 26th
Overall Rank in 2011: 15th
Overall Rank in 2009: 13th
| Performance by Category in 2012 | Ranking |
| Total Disbursements per Mile | 32 |
| Capital and Bridge Disbursements per Mile | 15 |
| Maintenance Disbursements per Mile | 35 |
| Administrative Disbursements per Mile | 33 |
| Rural Interstate Pavement Condition | 25 |
| Rural Arterial Pavement Condition | 32 |
| Urban Interstate Pavement Condition | 31 |
| Urban Interstate Congestion | 30 |
| Deficient Bridges | 27 |
| Fatality Rate | 18 |
| Narrow Rural Arterial Lanes | 18 |
| Overall Performance | 26 |
Pennsylvania ranks 41st in the nation in highway performance and cost-effectiveness in the Annual Highway Report by Reason Foundation.
Pennsylvania ranks 34th in fatality rate, 48th in deficient bridges, 20th in rural Interstate pavement condition, 23 rd in urban Interstate pavement condition and 33rd in urban Interstate congestion.
On spending, Pennsylvania ranks 26th in total disbursements per mile and 24th in administrative disbursements per mile.
Pennsylvania’s best rankings are rural Interstate pavement condition (20th), capital-bridge disbursements per mile (21st) and urban Interstate pavement condition (23rd).
Pennsylvania’s worst rankings are narrow rural arterial lanes (50th) and deficient bridges (48th).
Pennsylvania’s state-controlled highway mileage makes it the 5th largest system.
Pennsylvania’s Complete Results
Overall Rank in 2012: 41st
Overall Rank in 2011: 40th
Overall Rank in 2009: 39th
| Performance by Category in 2012 | Ranking |
| Total Disbursements per Mile | 26 |
| Capital and Bridge Disbursements per Mile | 21 |
| Maintenance Disbursements per Mile | 34 |
| Administrative Disbursements per Mile | 24 |
| Rural Interstate Pavement Condition | 20 |
| Rural Arterial Pavement Condition | 24 |
| Urban Interstate Pavement Condition | 23 |
| Urban Interstate Congestion | 33 |
| Deficient Bridges | 48 |
| Fatality Rate | 34 |
| Narrow Rural Arterial Lanes | 50 |
| Overall Performance | 41 |
Rhode Island ranks 47th in the nation in highway performance and cost-effectiveness in the Annual Highway Report by Reason Foundation.
Rhode Island ranks 7th in fatality rate, 50th in deficient bridges, 1st in rural Interstate pavement condition, 17 th in urban Interstate pavement condition and 31st in urban Interstate congestion.
On spending, Rhode Island ranks 47th in total disbursements per mile and 44th in administrative disbursements per mile.
Rhode Island’s best rankings are rural Interstate pavement condition (1st), fatality rate (7th) and urban Interstate pavement condition (17th).
Rhode Island’s worst rankings are deficient bridges (50th) and rural arterial pavement condition (48th).
Rhode Island’s state-controlled highway mileage makes it the 49th largest system.
Rhode Island’s Complete Results
Overall Rank in 2012: 47th
Overall Rank in 2011: 50th
Overall Rank in 2009: 49th
| Performance by Category in 2012 | Ranking |
| Total Disbursements per Mile | 47 |
| Capital and Bridge Disbursements per Mile | 47 |
| Maintenance Disbursements per Mile | 43 |
| Administrative Disbursements per Mile | 44 |
| Rural Interstate Pavement Condition | 1 |
| Rural Arterial Pavement Condition | 48 |
| Urban Interstate Pavement Condition | 17 |
| Urban Interstate Congestion | 31 |
| Deficient Bridges | 50 |
| Fatality Rate | 7 |
| Narrow Rural Arterial Lanes | 23 |
| Overall Performance | 47 |
South Carolina ranks 4th in the nation in highway performance and cost-effectiveness in the Annual Highway Report by Reason Foundation.
South Carolina ranks 49th in fatality rate, 22nd in deficient bridges, 13th in rural Interstate pavement condition, 15 th in urban Interstate pavement condition and 29th in urban Interstate congestion.
On spending, South Carolina ranks 1st in total disbursements per mile and 6th in administrative disbursements per mile.
South Carolina’s best rankings are total disbursements per mile (1st), capital-bridge disbursements per mile (3rd) and maintenance disbursements per mile (4th).
South Carolina’s worst rankings are fatality rate (49th), urban Interstate congestion (29th) and narrow rural arterial lanes (29th).
South Carolina’s state-controlled highway mileage makes it the 4th largest system.
South Carolina’s Complete Results
Overall Rank in 2012: 4th
Overall Rank in 2011: 5th
Overall Rank in 2009: 7th
| Performance by Category in 2012 | Ranking |
| Total Disbursements per Mile | 1 |
| Capital and Bridge Disbursements per Mile | 3 |
| Maintenance Disbursements per Mile | 4 |
| Administrative Disbursements per Mile | 6 |
| Rural Interstate Pavement Condition | 13 |
| Rural Arterial Pavement Condition | 10 |
| Urban Interstate Pavement Condition | 15 |
| Urban Interstate Congestion | 29 |
| Deficient Bridges | 22 |
| Fatality Rate | 49 |
| Narrow Rural Arterial Lanes | 29 |
| Overall Performance | 4 |
South Dakota ranks 3rd in the nation in highway performance and cost-effectiveness in the Annual Highway Report by Reason Foundation.
South Dakota ranks 41st in fatality rate, 32nd in deficient bridges, 12th in rural Interstate pavement condition, 13 th in urban Interstate pavement condition and 6th in urban Interstate congestion.
On spending, South Dakota ranks 4th in total disbursements per mile and 13th in administrative disbursements per mile.
South Dakota’s best rankings are maintenance disbursements per mile (3rd), total disbursements per mile (4th) and urban Interstate congestion (6th).
South Dakota’s worst rankings are fatality rate (41st) and deficient bridges (32nd).
South Dakota’s state-controlled highway mileage makes it the 32nd largest system.
South Dakota’s Complete Results
Overall Rank in 2012: 3rd
Overall Rank in 2011: 1st
Overall Rank in 2009: 9th
| Performance by Category in 2012 | Ranking |
| Total Disbursements per Mile | 4 |
| Capital and Bridge Disbursements per Mile | 7 |
| Maintenance Disbursements per Mile | 3 |
| Administrative Disbursements per Mile | 13 |
| Rural Interstate Pavement Condition | 12 |
| Rural Arterial Pavement Condition | 27 |
| Urban Interstate Pavement Condition | 13 |
| Urban Interstate Congestion | 6 |
| Deficient Bridges | 32 |
| Fatality Rate | 41 |
| Narrow Rural Arterial Lanes | 8 |
| Overall Performance | 3 |
Tennessee ranks 17th in the nation in highway performance and cost-effectiveness in the Annual Highway Report by Reason Foundation.
Tennessee ranks 38th in fatality rate, 12th in deficient bridges, 21st in rural Interstate pavement condition, 20 th in urban Interstate pavement condition and 21st in urban Interstate congestion.
On spending, Tennessee ranks 18th in total disbursements per mile and 23rd in administrative disbursements per mile.
Tennessee’s best rankings are deficient bridges (12th), rural arterial pavement condition (16th) and total disbursements per mile (18 th).
Tennessee’s worst rankings are narrow rural arterial lanes (41st) and fatality rate (38th).
Tennessee’s state-controlled highway mileage makes it the 17th largest system.
Tennessee’s Complete Results
Overall Rank in 2012: 17th
Overall Rank in 2011: 20th
Overall Rank in 2009: 21st
| Performance by Category in 2012 | Ranking |
| Total Disbursements per Mile | 18 |
| Capital and Bridge Disbursements per Mile | 29 |
| Maintenance Disbursements per Mile | 21 |
| Administrative Disbursements per Mile | 23 |
| Rural Interstate Pavement Condition | 21 |
| Rural Arterial Pavement Condition | 16 |
| Urban Interstate Pavement Condition | 20 |
| Urban Interstate Congestion | 21 |
| Deficient Bridges | 12 |
| Fatality Rate | 38 |
| Narrow Rural Arterial Lanes | 41 |
| Overall Performance | 17 |
Texas ranks 11th in the nation in highway performance and cost-effectiveness in the Annual Highway Report by Reason Foundation.
Texas ranks 40th in fatality rate, 14th in deficient bridges, 24th in rural Interstate pavement condition, 27th in urban Interstate pavement condition and 27th in urban Interstate congestion.
On spending, Texas ranks 23rd in total disbursements per mile and 9th in administrative disbursements per mile.
Texas’ best rankings are rural arterial pavement condition (8th), administrative disbursements per mile (9th) and deficient bridges (14th).
Texas’ worst rankings are fatality rate (40th) and capital-bridge disbursements per mile (32nd).
Texas’ state-controlled highway mileage makes it the largest system in the country.
Texas’ Complete Results
Overall Rank in 2012: 11th
Overall Rank in 2011: 14th
Overall Rank in 2009: 11th
| Performance by Category in 2012 | Ranking |
| Total Disbursements per Mile | 23 |
| Capital and Bridge Disbursements per Mile | 32 |
| Maintenance Disbursements per Mile | 29 |
| Administrative Disbursements per Mile | 9 |
| Rural Interstate Pavement Condition | 24 |
| Rural Arterial Pavement Condition | 8 |
| Urban Interstate Pavement Condition | 27 |
| Urban Interstate Congestion | 27 |
| Deficient Bridges | 14 |
| Fatality Rate | 40 |
| Narrow Rural Arterial Lanes | 17 |
| Overall Performance | 11 |
Utah ranks 29th in the nation in highway performance and cost-effectiveness in the Annual Highway Report by Reason Foundation.
Utah ranks 6th in fatality rate, 4th in deficient bridges, 9th in rural Interstate pavement condition, 5th in urban Interstate pavement condition and 34th in urban Interstate congestion.
On spending, Utah ranks 41st in total disbursements per mile and 46th in administrative disbursements per mile.
Utah’s best rankings are narrow rural arterial lanes (1st), rural arterial pavement condition (4th) and deficient bridges (4 th).
Utah’s worst rankings are administrative disbursements per mile (46th) maintenance disbursements per mile (41st) and total disbursements per mile (41st).
Utah’s state-controlled highway mileage makes it the 39th largest system.
Utah’s Complete Results
Overall Rank in 2012: 29th
Overall Rank in 2011: 27th
Overall Rank in 2009: 26th
| Performance by Category in 2012 | Ranking |
| Total Disbursements per Mile | 41 |
| Capital and Bridge Disbursements per Mile | 40 |
| Maintenance Disbursements per Mile | 41 |
| Administrative Disbursements per Mile | 46 |
| Rural Interstate Pavement Condition | 9 |
| Rural Arterial Pavement Condition | 4 |
| Urban Interstate Pavement Condition | 5 |
| Urban Interstate Congestion | 34 |
| Deficient Bridges | 4 |
| Fatality Rate | 6 |
| Narrow Rural Arterial Lanes | 1 |
| Overall Performance | 29 |
Vermont ranks 38th in the nation in highway performance and cost-effectiveness in the Annual Highway Report by Reason Foundation.
Vermont ranks 20th in fatality rate, 41st in deficient bridges, 15th in rural Interstate pavement condition, 10 th in urban Interstate pavement condition and 5th in urban Interstate congestion.
On spending, Vermont ranks 34th in total disbursements per mile and 43rd in administrative disbursements per mile.
Vermont’s best rankings are urban Interstate congestion (5th), urban Interstate pavement condition (10th) and rural Interstate pavement condition (15th).
Vermont’s worst rankings are administrative disbursements per mile (43rd) maintenance disbursements per mile (42nd) and narrow rural arterial lanes (42nd).
Vermont’s state-controlled highway mileage makes it the 48th largest system.
Vermont’s Complete Results
Overall Rank in 2012: 38th
Overall Rank in 2011: 39th
Overall Rank in 2009: 28th
| Performance by Category in 2012 | Ranking |
| Total Disbursements per Mile | 34 |
| Capital and Bridge Disbursements per Mile | 30 |
| Maintenance Disbursements per Mile | 42 |
| Administrative Disbursements per Mile | 43 |
| Rural Interstate Pavement Condition | 15 |
| Rural Arterial Pavement Condition | 41 |
| Urban Interstate Pavement Condition | 10 |
| Urban Interstate Congestion | 5 |
| Deficient Bridges | 41 |
| Fatality Rate | 20 |
| Narrow Rural Arterial Lanes | 42 |
| Overall Performance | 38 |
Virginia ranks 25th in the nation in highway performance and cost-effectiveness in the Annual Highway Report by Reason Foundation.
Virginia ranks 13th in fatality rate, 29th in deficient bridges, 8th in rural Interstate pavement condition, 19 th in urban Interstate pavement condition and 40th in urban Interstate congestion.
On spending, Virginia ranks 7th in total disbursements per mile and 12th in administrative disbursements per mile.
Virginia’s best rankings are rural arterial pavement condition (1st), capital-bridge disbursements per mile (1st) and total disbursements per mile (7th).
Virginia’s worst rankings are narrow rural arterial lanes (48th) and urban Interstate congestion (40th).
Virginia’s state-controlled highway mileage makes it the 3rd largest system.
Virginia’s Complete Results
Overall Rank in 2012: 25th
Overall Rank in 2011: 22nd
Overall Rank in 2009: 15th
| Performance by Category in 2012 | Ranking |
| Total Disbursements per Mile | 7 |
| Capital and Bridge Disbursements per Mile | 1 |
| Maintenance Disbursements per Mile | 32 |
| Administrative Disbursements per Mile | 12 |
| Rural Interstate Pavement Condition | 8 |
| Rural Arterial Pavement Condition | 1 |
| Urban Interstate Pavement Condition | 19 |
| Urban Interstate Congestion | 40 |
| Deficient Bridges | 29 |
| Fatality Rate | 13 |
| Narrow Rural Arterial Lanes | 48 |
| Overall Performance | 25 |
Washington ranks 42nd in the nation in highway performance and cost-effectiveness in the Annual Highway Report by Reason Foundation.
Washington ranks 4th in fatality rate, 37th in deficient bridges, 47th in rural Interstate pavement condition, 42 nd in urban Interstate pavement condition and 42nd in urban Interstate congestion.
On spending, Washington ranks 37th in total disbursements per mile and 25th in administrative disbursements per mile.
Washington’s best rankings are fatality rate (4th), rural arterial pavement condition (23rd) and administrative disbursements per mile (25th).
Washington’s worst rankings are rural Interstate pavement condition (47th), narrow rural arterial narrow lanes (44th) and capital-bridge disbursements per mile (44th).
Washington’s state-controlled highway mileage makes it the 12th largest system.
Washington’s Complete Results
Overall Rank in 2012: 42nd
Overall Rank in 2011: 42nd
Overall Rank in 2009: 24th
| Performance by Category in 2012 | Ranking |
| Total Disbursements per Mile | 37 |
| Capital and Bridge Disbursements per Mile | 44 |
| Maintenance Disbursements per Mile | 38 |
| Administrative Disbursements per Mile | 25 |
| Rural Interstate Pavement Condition | 47 |
| Rural Arterial Pavement Condition | 23 |
| Urban Interstate Pavement Condition | 42 |
| Urban Interstate Congestion | 42 |
| Deficient Bridges | 37 |
| Fatality Rate | 4 |
| Narrow Rural Arterial Lanes | 44 |
| Overall Performance | 42 |
West Virginia ranks 34th in the nation in highway performance and cost-effectiveness in the Annual Highway Report by Reason Foundation.
West Virginia ranks 50th in fatality rate, 44th in deficient bridges, 36th in rural Interstate pavement condition, 25 th in urban Interstate pavement condition and 9th in urban Interstate congestion.
On spending, West Virginia ranks 2nd in total disbursements per mile and 8th in administrative disbursements per mile.
West Virginia’s best rankings are total disbursements per mile (2nd), capital-bridge disbursements per mile (2nd) and maintenance disbursements per mile (7th).
West Virginia’s worst rankings are fatality rate (50th) and narrow rural arterial lanes (49th).
West Virginia’s state-controlled highway mileage makes it the 6th largest system.
West Virginia’s Complete Results
Overall Rank in 2012: 34th
Overall Rank in 2011: 34th
Overall Rank in 2009: 32nd
| Performance by Category in 2012 | Ranking |
| Total Disbursements per Mile | 2 |
| Capital and Bridge Disbursements per Mile | 2 |
| Maintenance Disbursements per Mile | 7 |
| Administrative Disbursements per Mile | 8 |
| Rural Interstate Pavement Condition | 36 |
| Rural Arterial Pavement Condition | 33 |
| Urban Interstate Pavement Condition | 25 |
| Urban Interstate Congestion | 9 |
| Deficient Bridges | 44 |
| Fatality Rate | 50 |
| Narrow Rural Arterial Lanes | 49 |
| Overall Performance | 34 |
Wisconsin ranks 15th in the nation in highway performance and cost-effectiveness in the Annual Highway Report by Reason Foundation.
Wisconsin ranks 19th in fatality rate, 7th in deficient bridges, 16th in rural Interstate pavement condition, 28 th in urban Interstate pavement condition and 8th in urban Interstate congestion.
On spending, Wisconsin ranks 36th in total disbursements per mile and 30th in administrative disbursements per mile.
Wisconsin’s best rankings are deficient bridges (7th), urban Interstate congestion (8th) and narrow rural arterial lanes (15 th).
Wisconsin’s worst rankings are rural arterial pavement condition (38th) and total disbursements per mile (36th).
Wisconsin’s state-controlled highway mileage makes it the 22nd largest system.
Wisconsin’s Complete Results
Overall Rank in 2012: 15th
Overall Rank in 2011: 25th
Overall Rank in 2009: 31st
| Performance by Category in 2012 | Ranking |
| Total Disbursements per Mile | 36 |
| Capital and Bridge Disbursements per Mile | 35 |
| Maintenance Disbursements per Mile | 19 |
| Administrative Disbursements per Mile | 30 |
| Rural Interstate Pavement Condition | 16 |
| Rural Arterial Pavement Condition | 38 |
| Urban Interstate Pavement Condition | 28 |
| Urban Interstate Congestion | 8 |
| Deficient Bridges | 7 |
| Fatality Rate | 19 |
| Narrow Rural Arterial Lanes | 15 |
| Overall Performance | 15 |
Wyoming ranks 1st in the nation in highway performance and cost-effectiveness in the Annual Highway Report by Reason Foundation.
Wyoming ranks 35th in fatality rate, 6th in deficient bridges, 1st in rural Interstate pavement condition, 32nd in urban Interstate pavement condition and 1st in urban Interstate congestion.
On spending, Wyoming ranks 12th in total disbursements per mile and 18th in administrative disbursements per mile.
Wyoming’s best rankings are rural Interstate pavement condition (1st), urban Interstate congestion (1st) and narrow rural arterial lanes (1st).
Wyoming’s worst rankings are fatality rate (35th) and urban Interstate pavement condition (32nd).
Wyoming’s state-controlled highway mileage makes it the 35th largest system.
Wyoming’s Complete Results
Overall Rank in 2012: 1st
Overall Rank in 2011: 4th
Overall Rank in 2009: 3rd
| Performance by Category in 2012 | Ranking |
| Total Disbursements per Mile | 12 |
| Capital and Bridge Disbursements per Mile | 13 |
| Maintenance Disbursements per Mile | 9 |
| Administrative Disbursements per Mile | 18 |
| Rural Interstate Pavement Condition | 1 |
| Rural Arterial Pavement Condition | 9 |
| Urban Interstate Pavement Condition | 32 |
| Urban Interstate Congestion | 1 |
| Deficient Bridges | 6 |
| Fatality Rate | 35 |
| Narrow Rural Arterial Lanes | 1 |
| Overall Performance | 1 |
