| Performance of State-Owned Highways, 2009-2012 by Statistic |
2009 |
2010 |
2011 |
2012 |
Percent Change 2011-12 |
Percent Change 2009-12 |
| Mileage under State Control (Thousands) |
814.29 |
NA |
813.69 |
814.28 |
0.07 |
0 |
| Total Revenues, All Sources, $ Billions |
117.02 |
131.27 |
126.69 |
132.86 |
4.87 |
13.54 |
| Total Expenditures, $ Billions |
117.69 |
122.51 |
124.16 |
132.01 |
6.32 |
12.17 |
| Expenditures, Capital/Bridges, $ Billions |
65.1 |
66.48 |
66.6 |
70.15 |
5.33 |
7.76 |
| Expenditures, Maintenance, $ Billions |
20.76 |
20.92 |
20.45 |
21.24 |
3.86 |
2.31 |
| Expenditures, Administration, $ Billions |
9.25 |
8.55 |
8.49 |
8.61 |
1.41 |
-6.92 |
| Consumer Price Index (1987=100) |
188.9 |
192 |
198 |
202.1 |
2.07 |
6.99 |
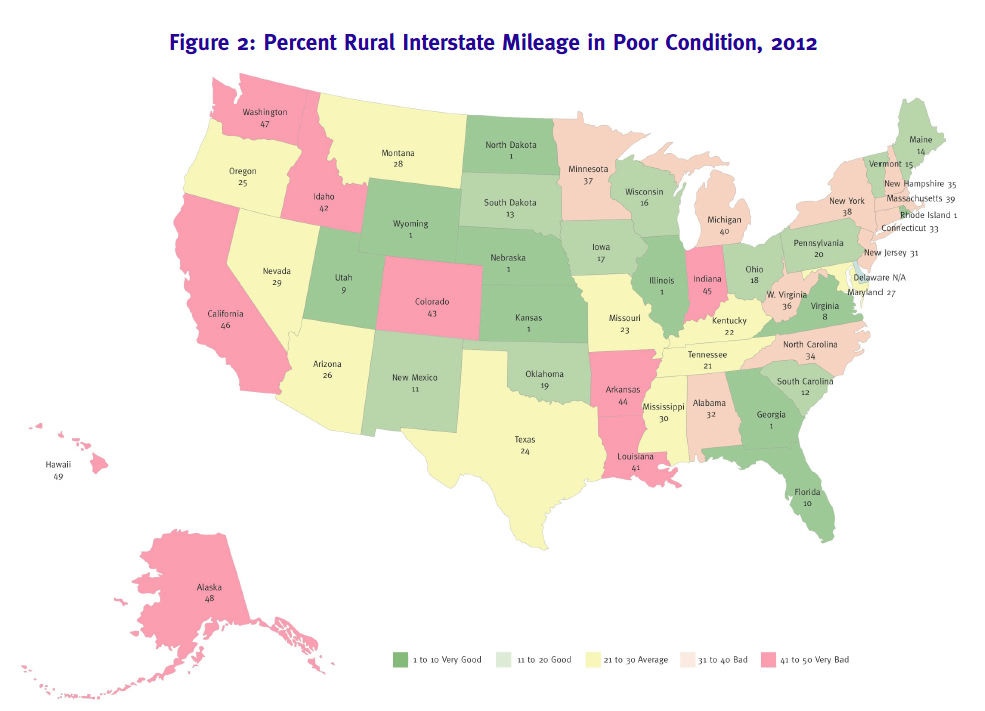
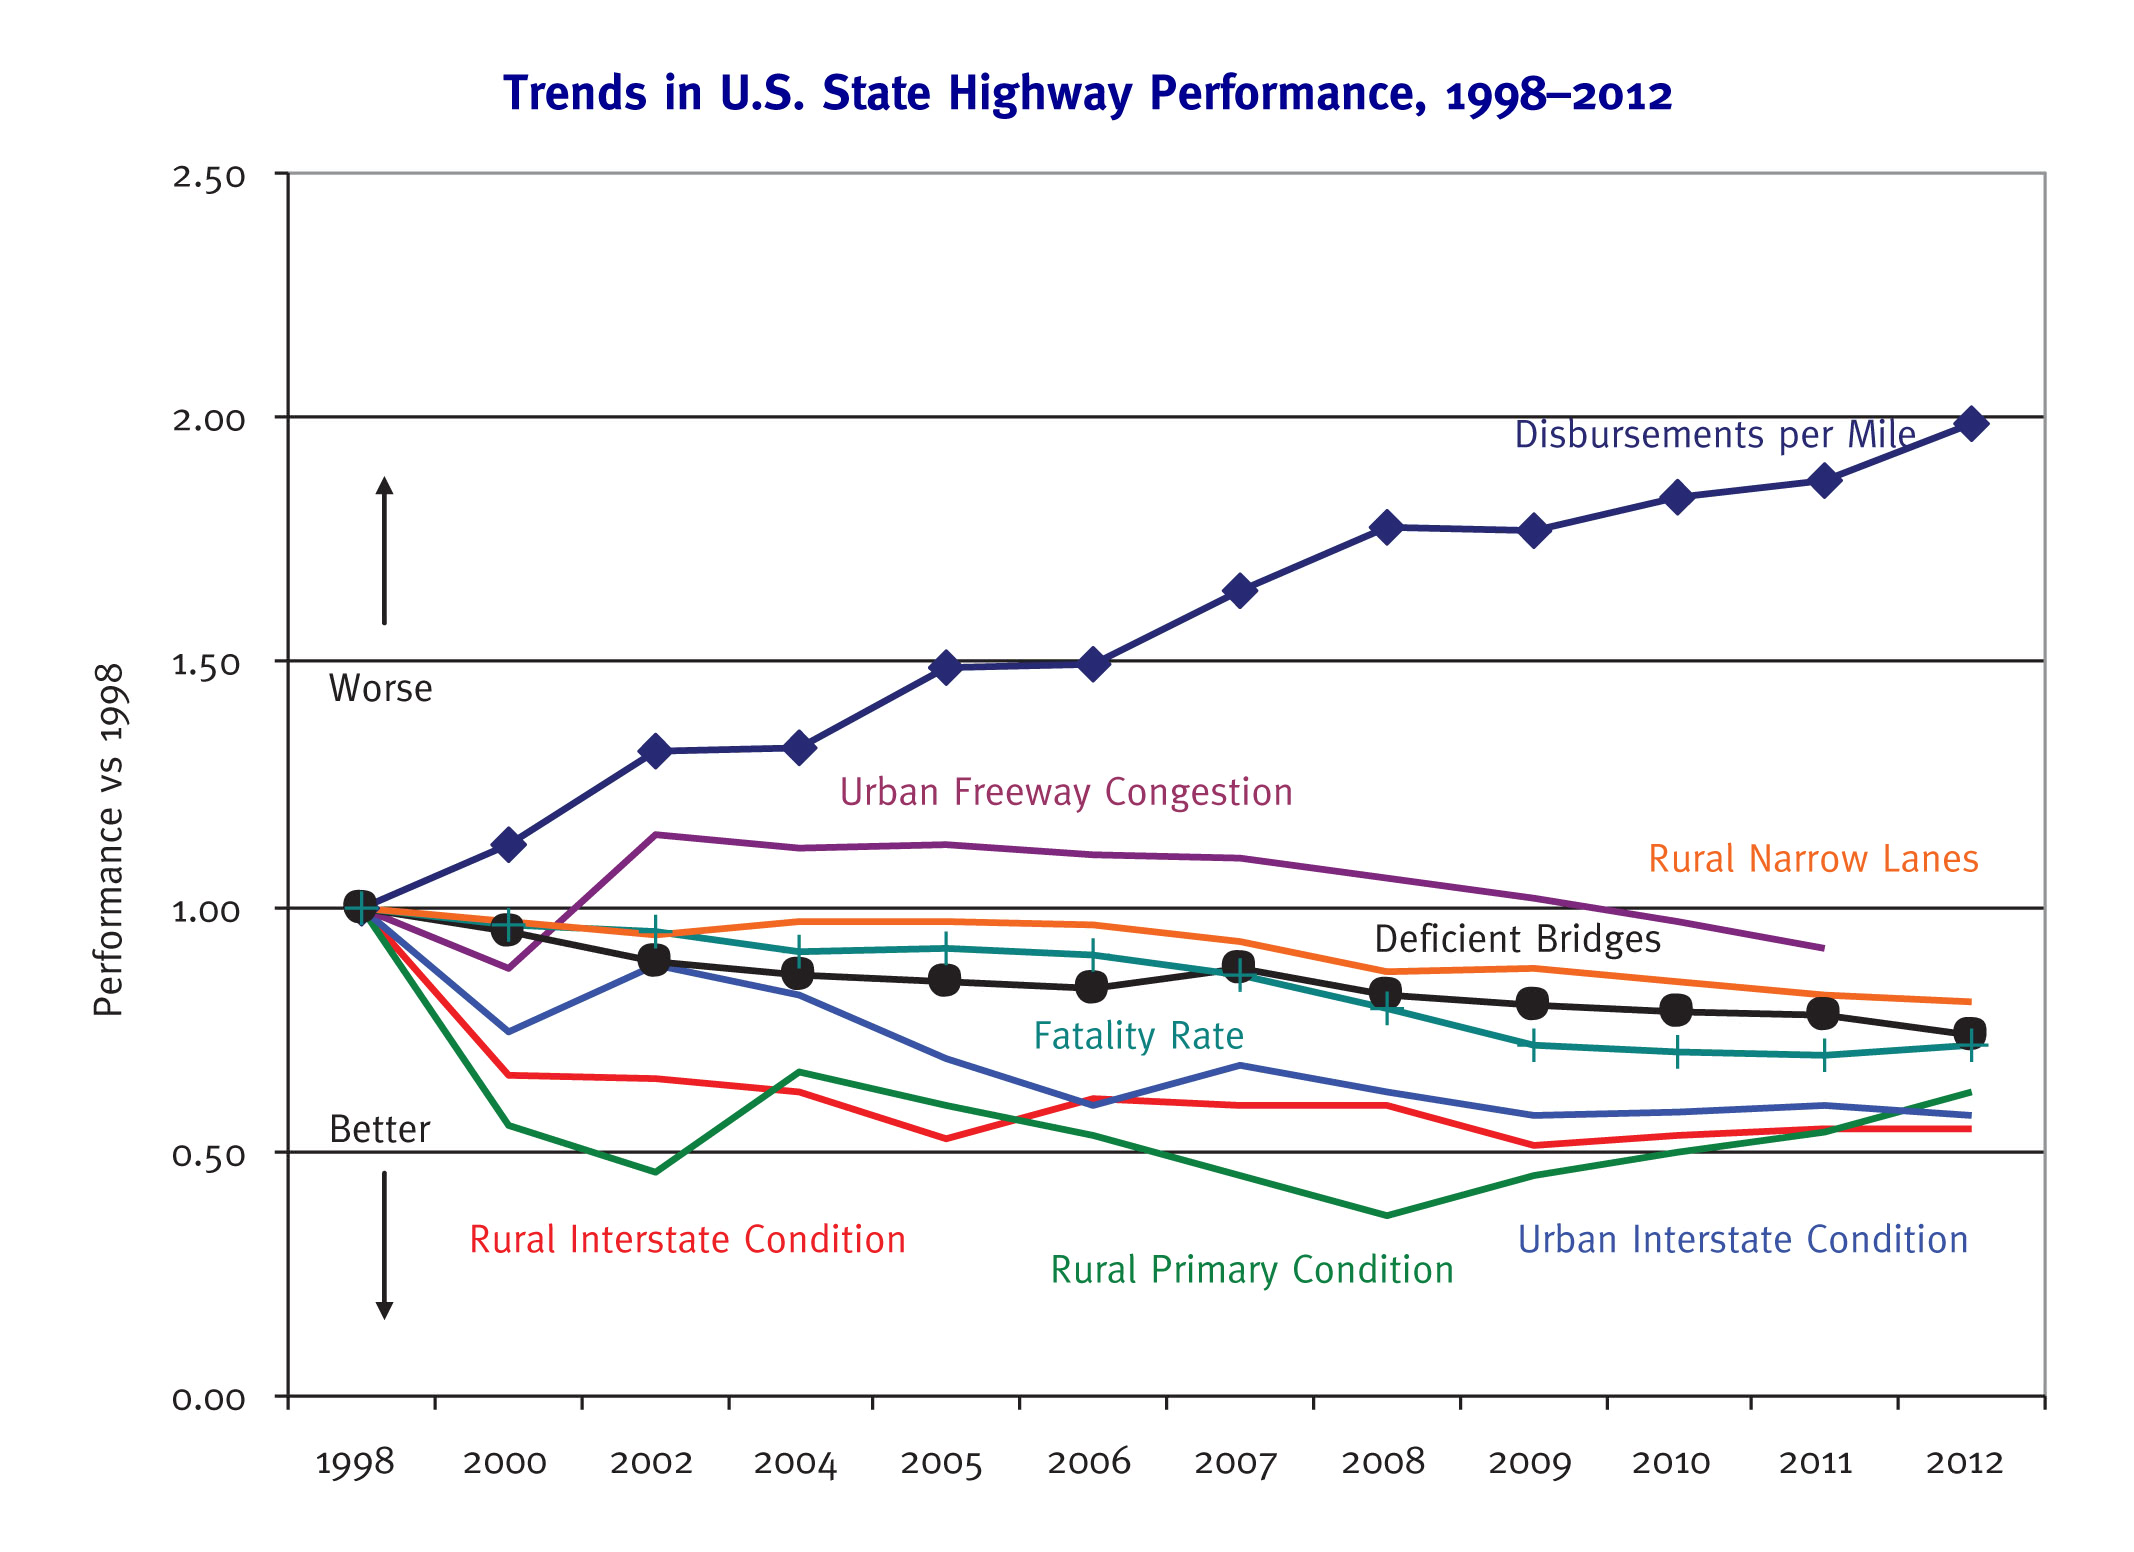
| Rural Interstate, Percent Poor Condition |
1.67 |
NA |
1.78 |
1.78 |
0 |
6.59 |
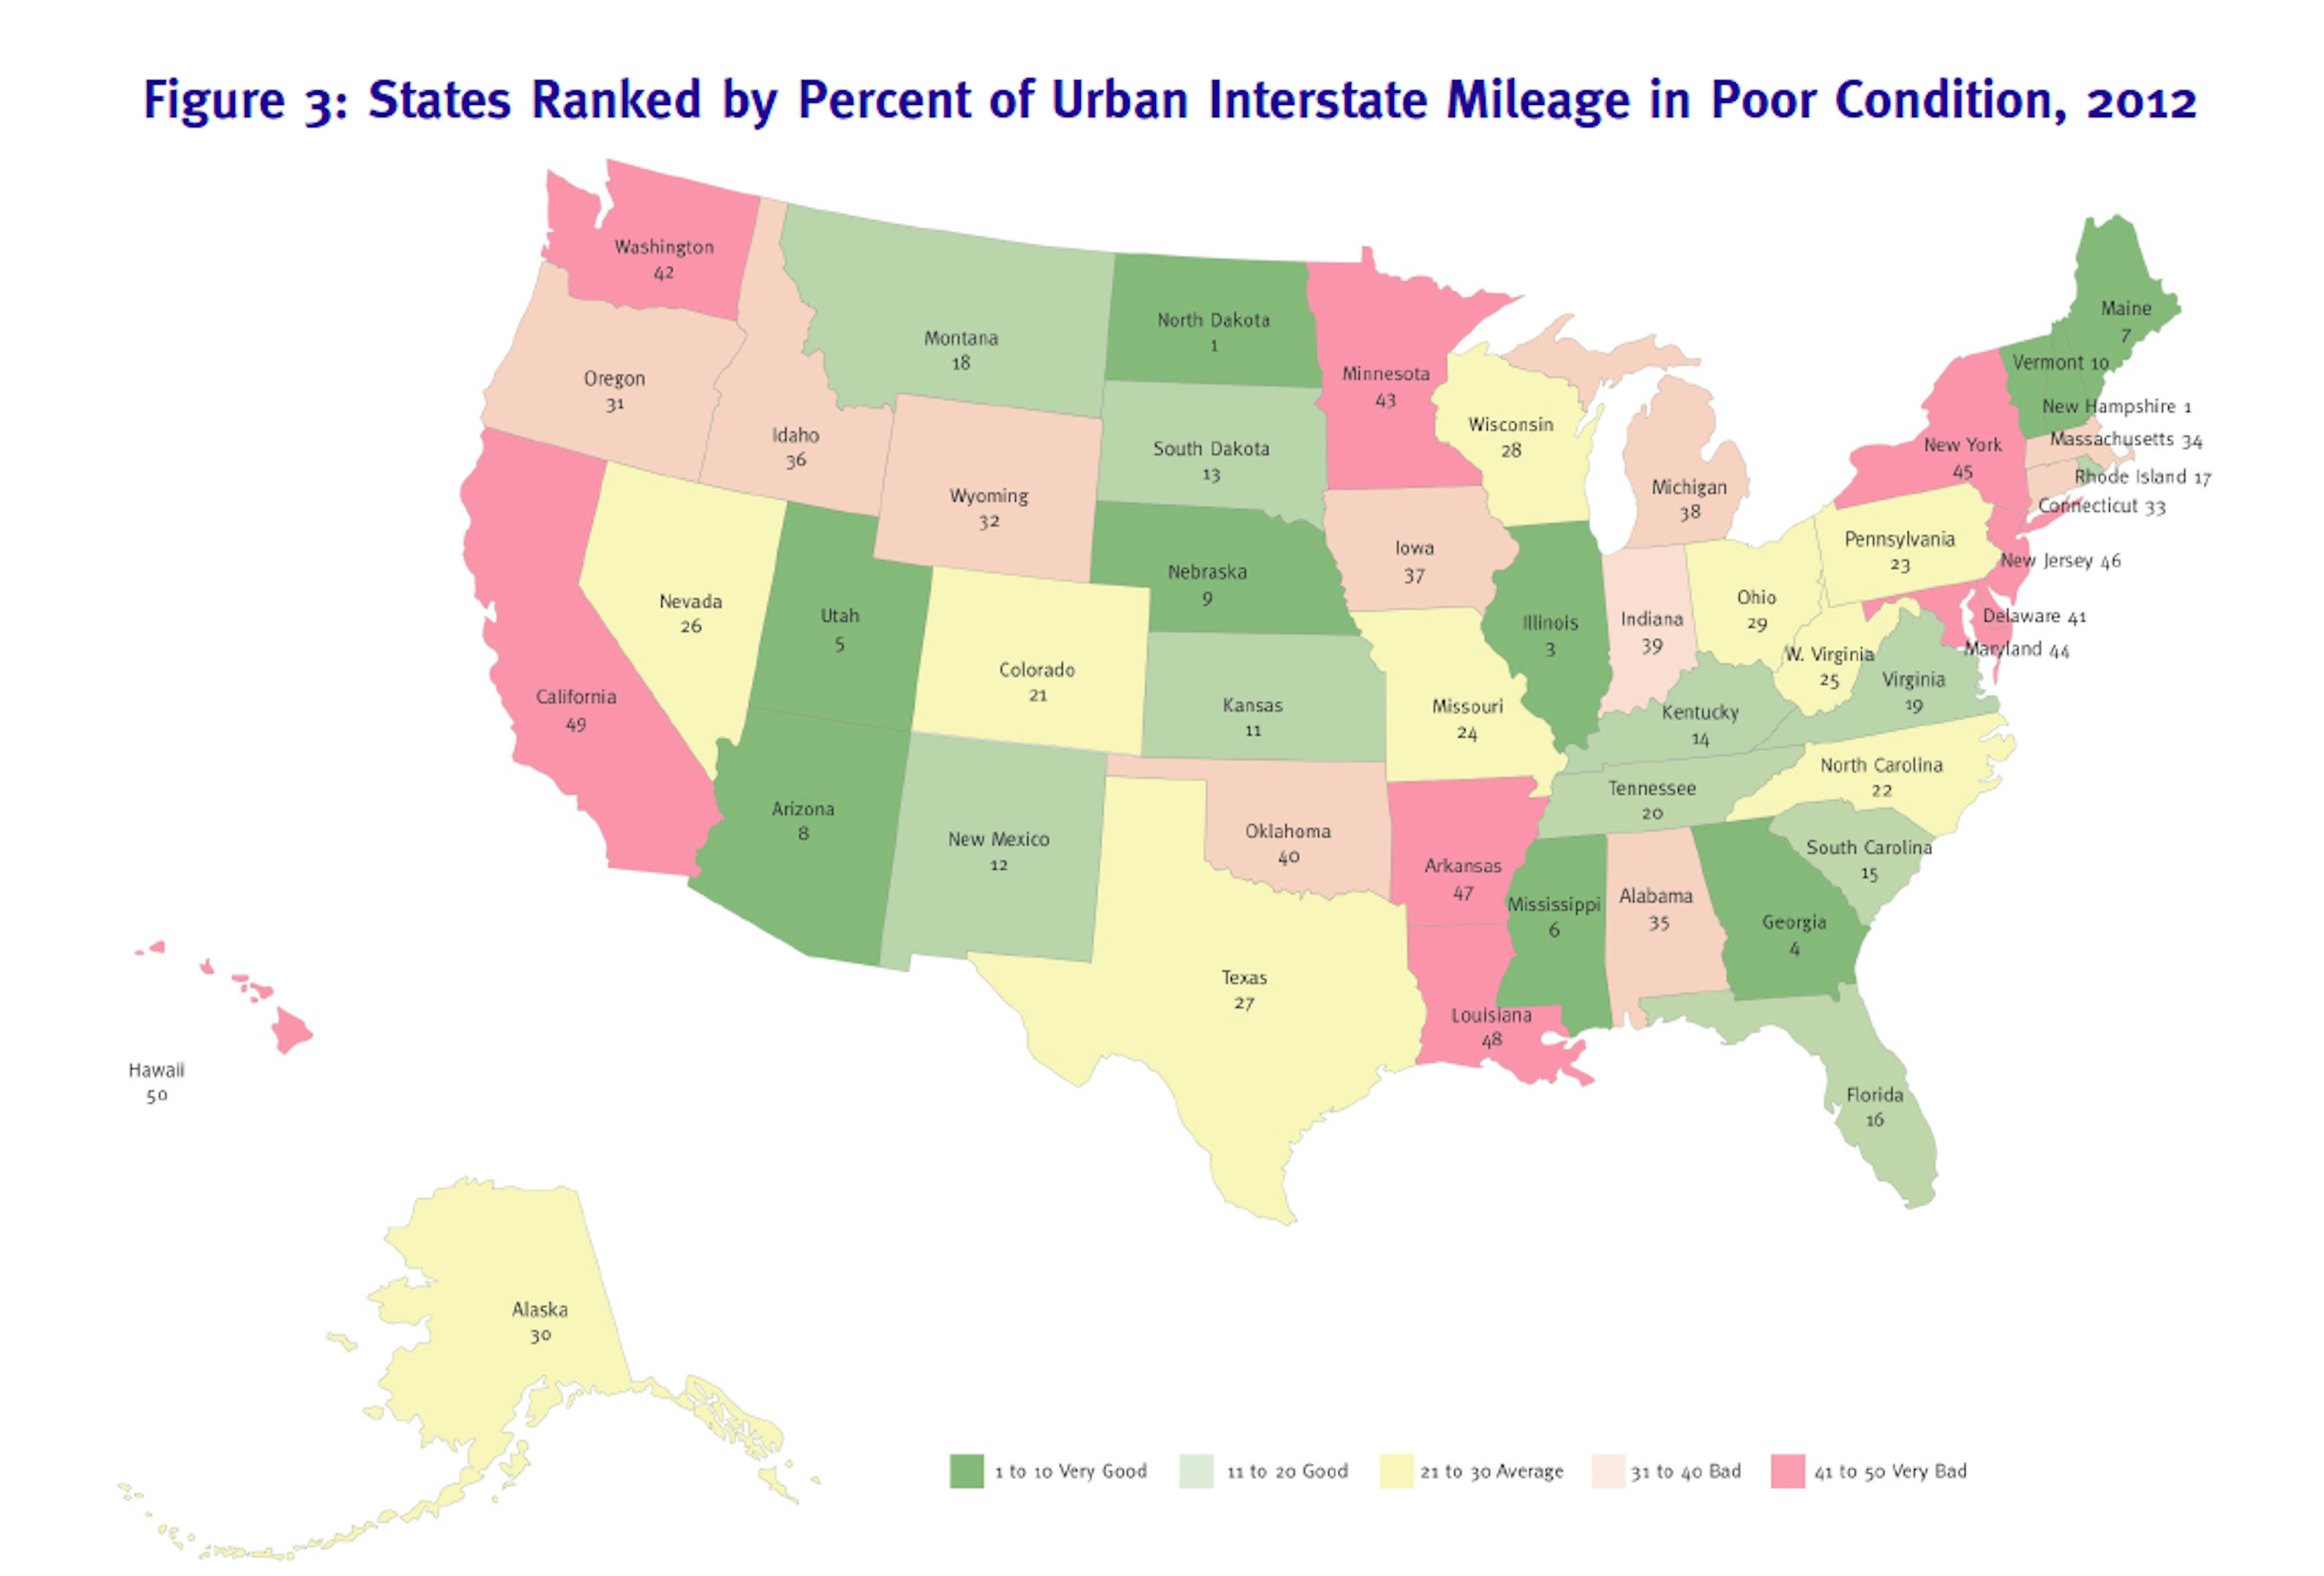
| Urban Interstate, Percent Poor Condition |
4.97 |
NA |
5.18 |
4.97 |
-4.05 |
0 |
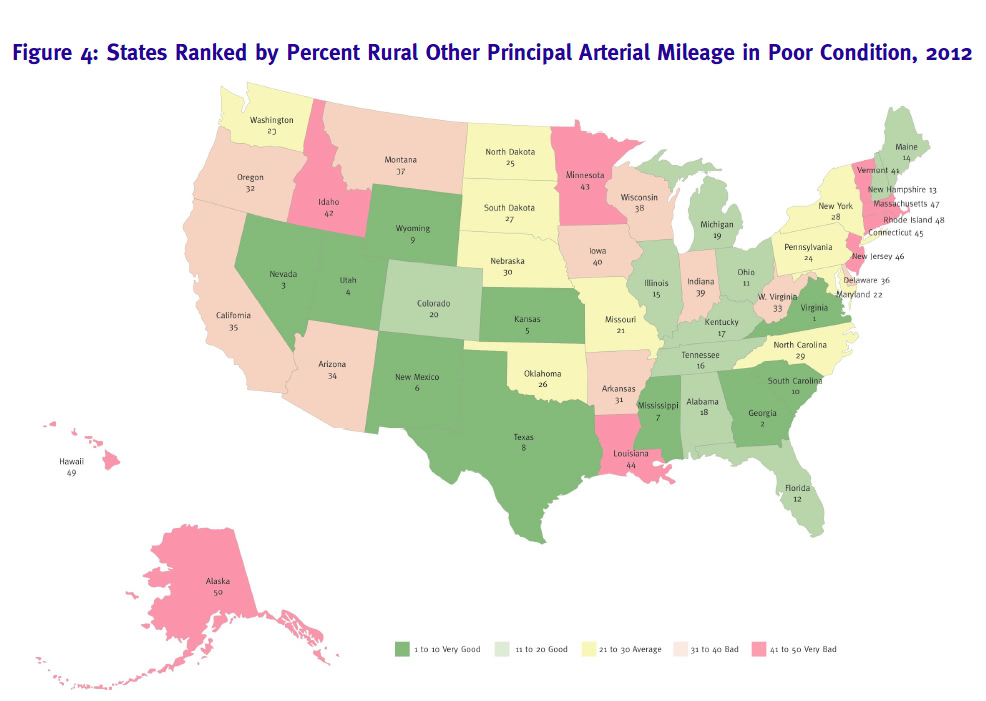
| Rural Arterial, Percent Poor Condition |
0.65 |
NA |
0.77 |
0.89 |
15.58 |
36.92 |
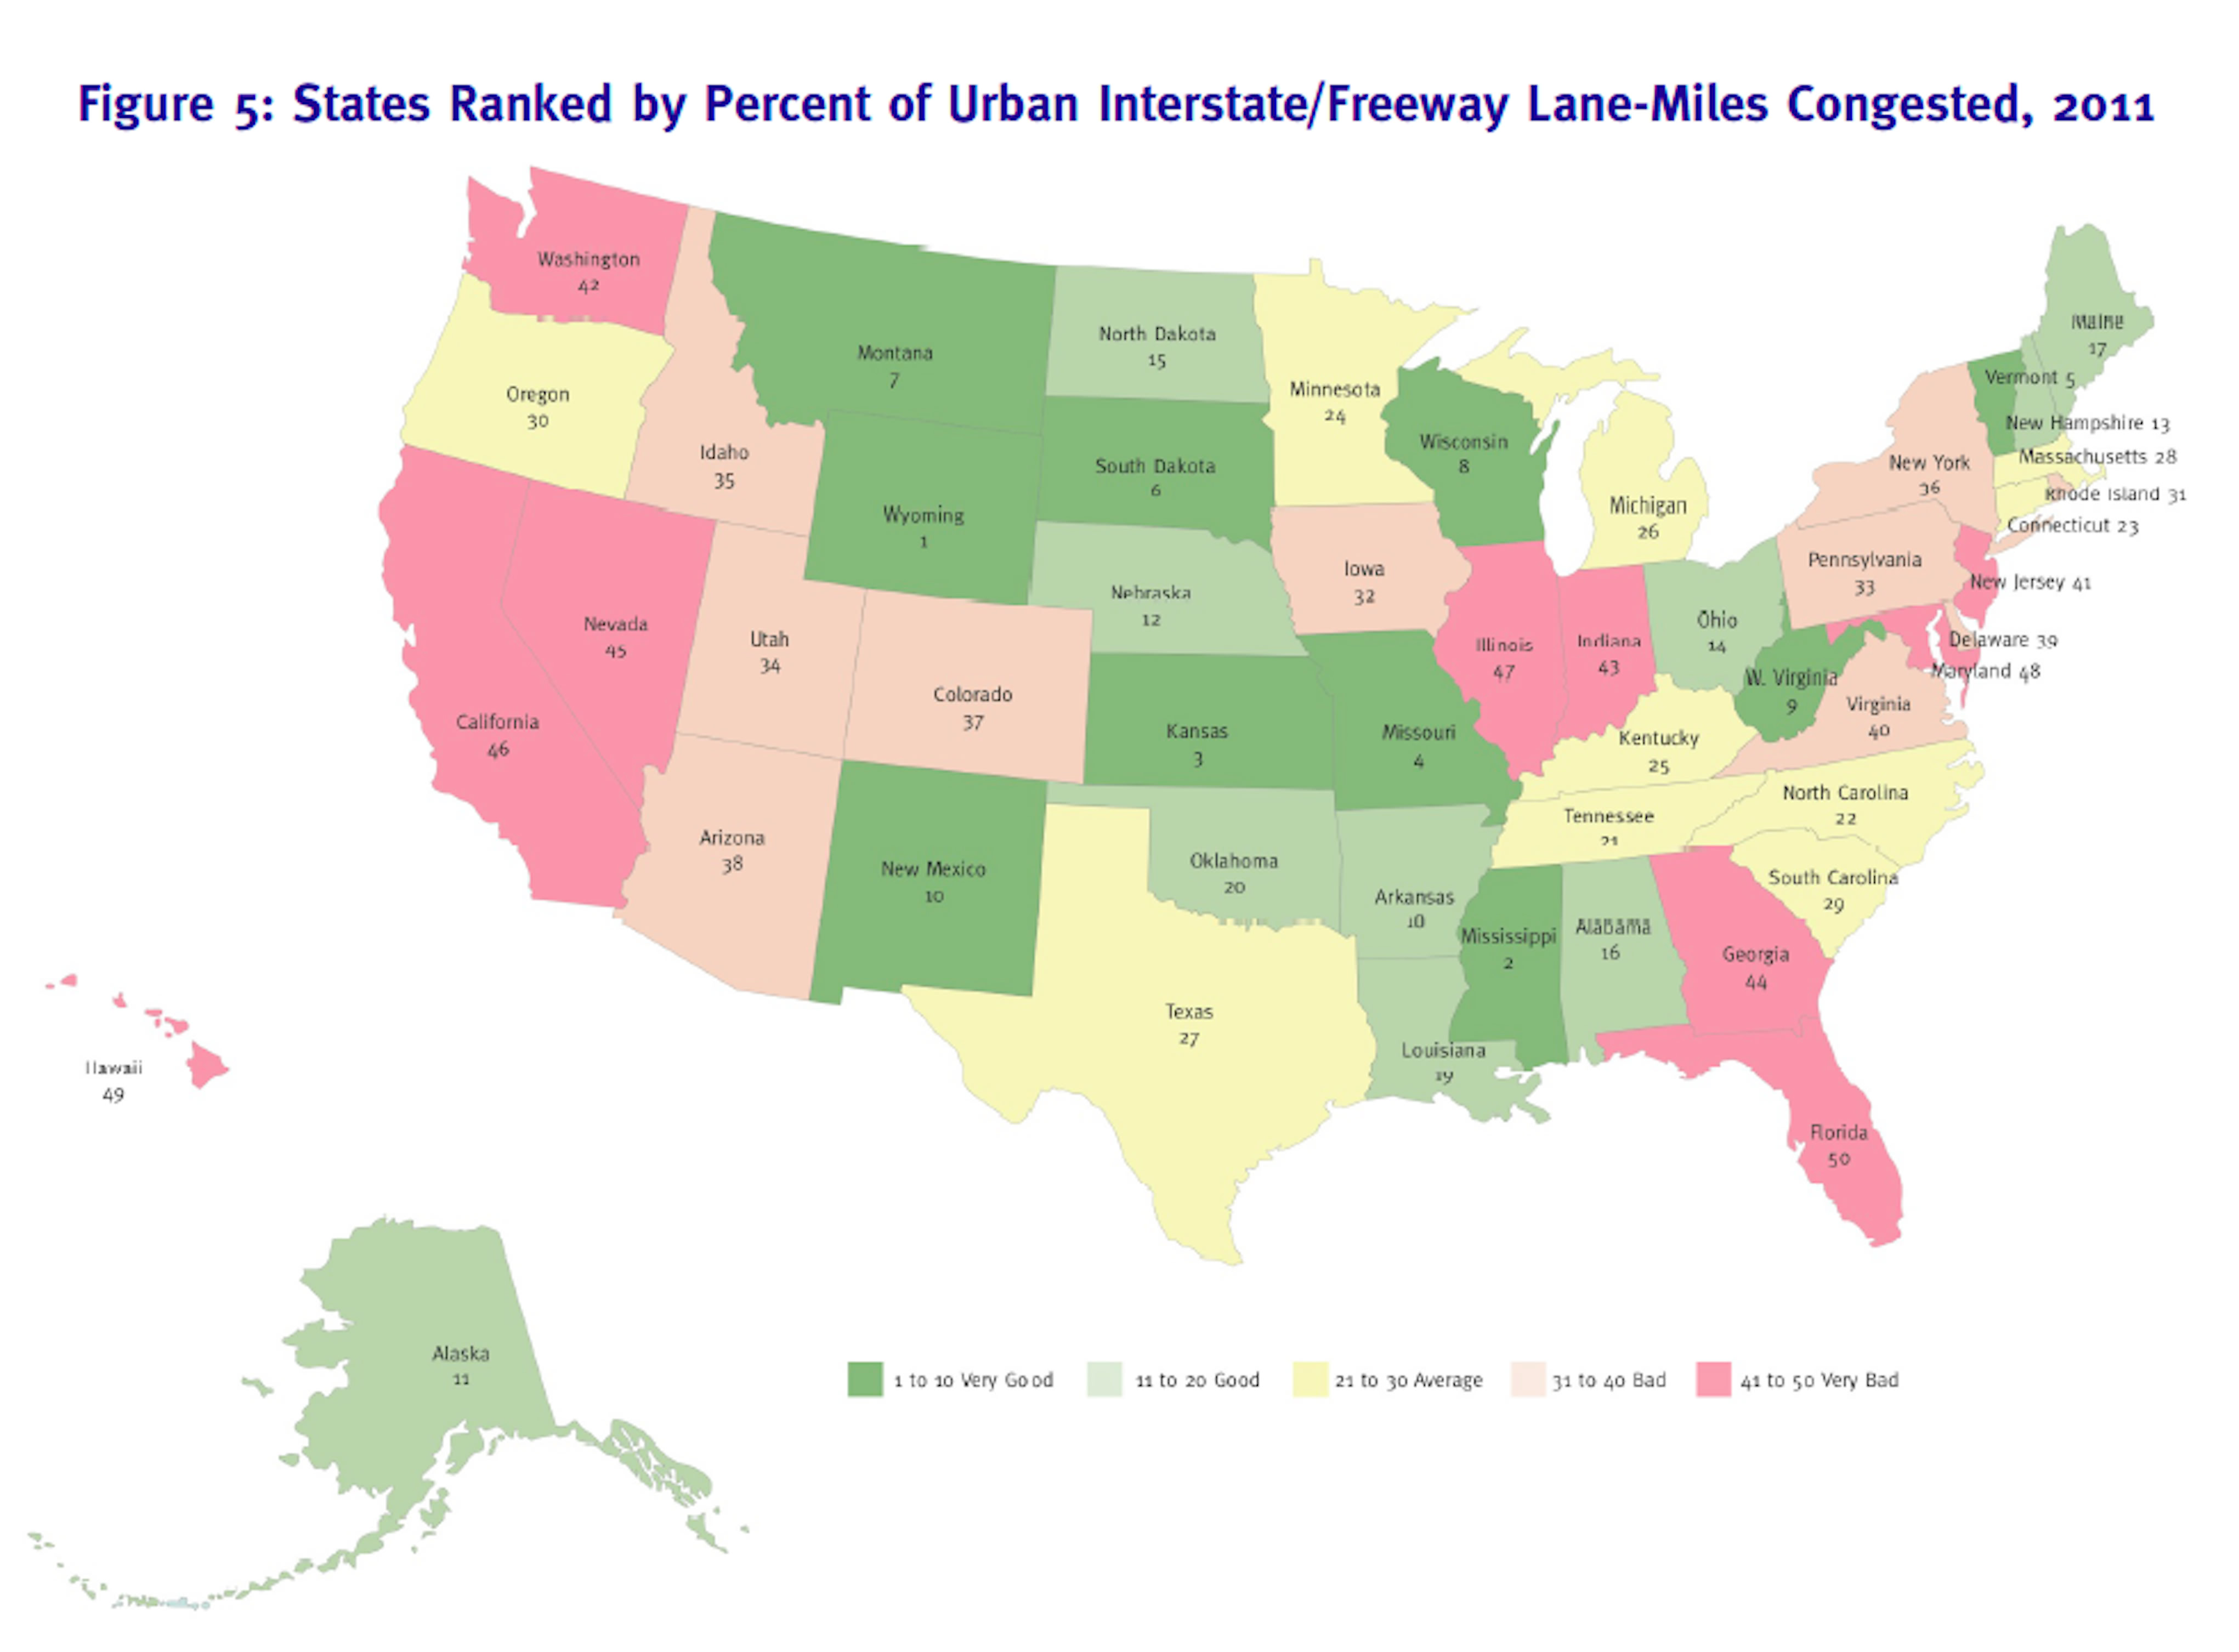
| Urban Interstate/Freeway, Percent Congested |
46.67 |
NA |
*42.15 |
NA |
NA |
**-9.69 |
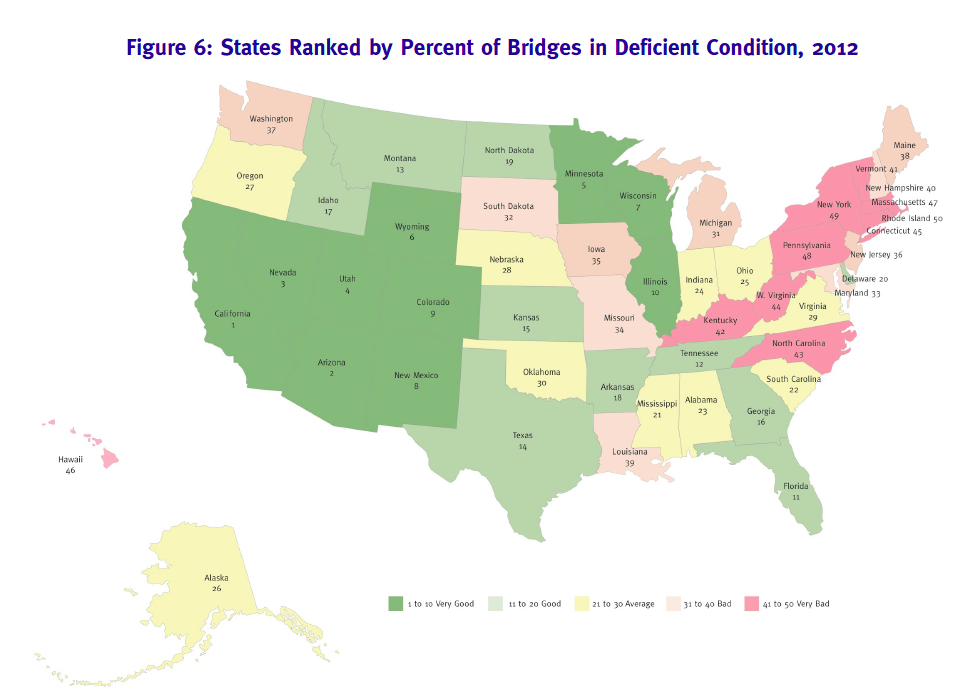
| Bridges, Percent Deficient |
23.24 |
22.71 |
22.52 |
21.52 |
-4.44 |
-7.4 |
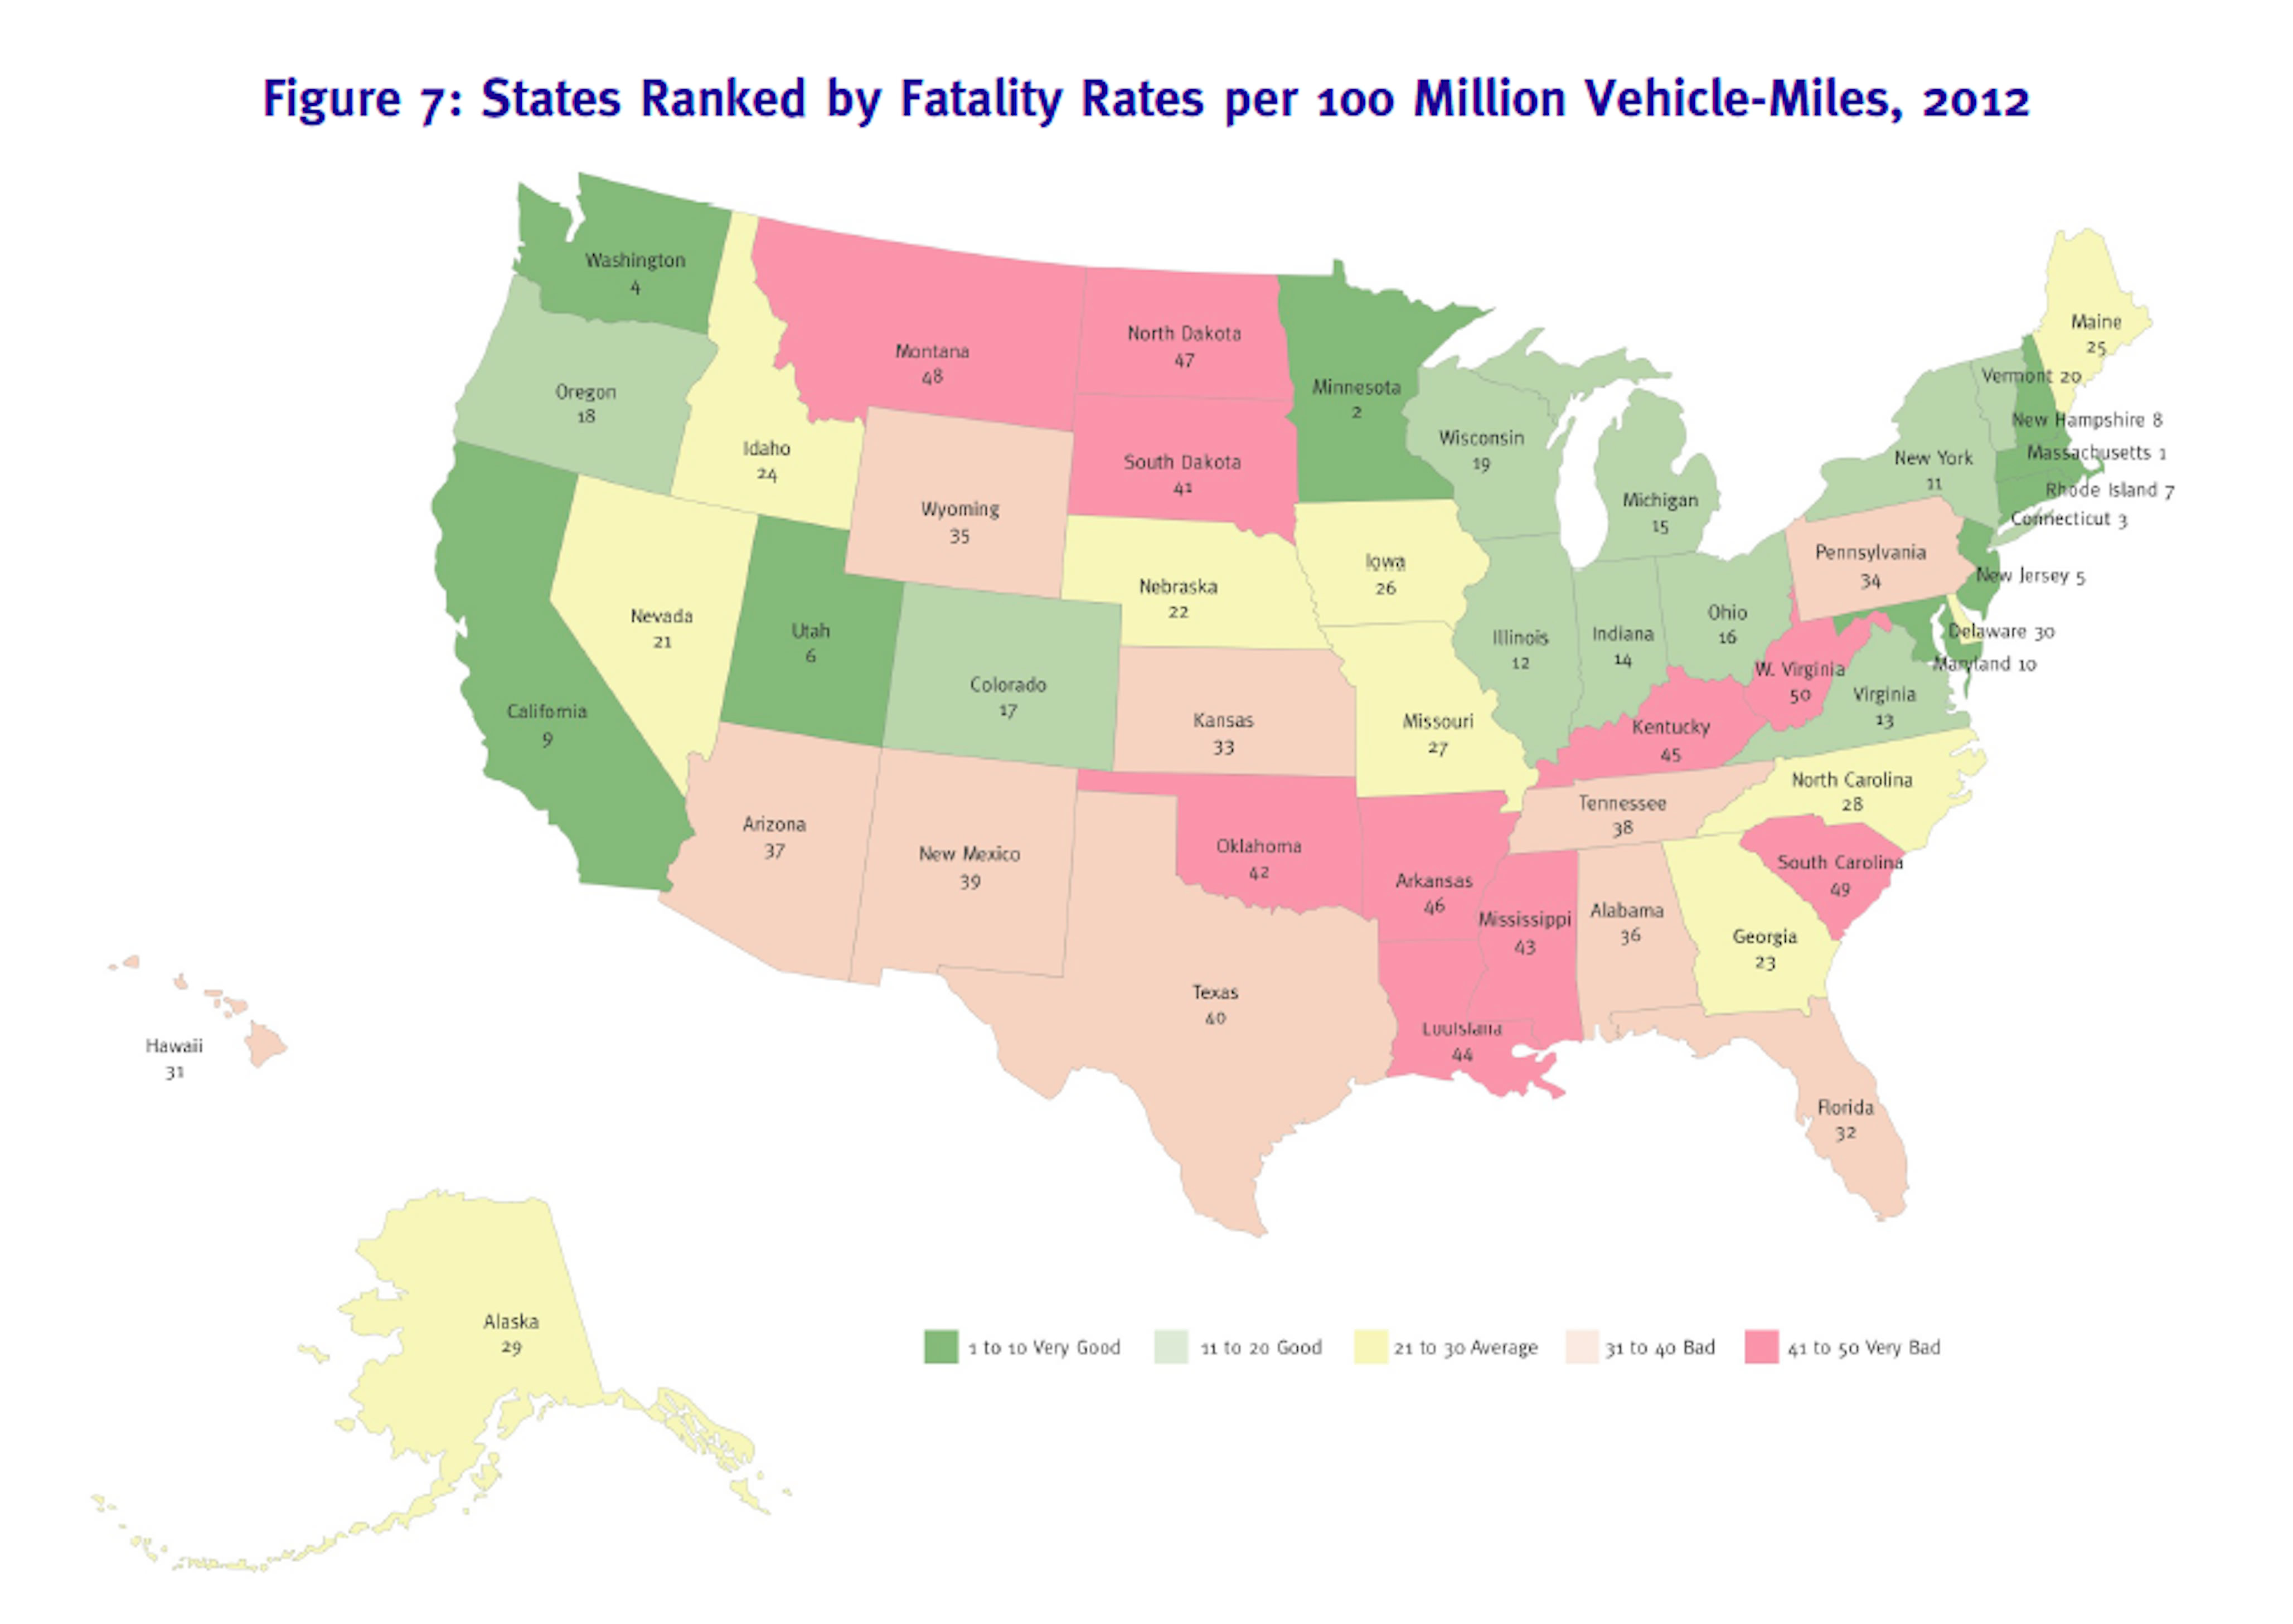
| Fatality Rate per 100 Million Vehicle-Miles |
1.15 |
1.11 |
1.1 |
1.13 |
2.72 |
-1.74 |
| Rural Primary, Percent Narrow Lanes |
9.66 |
NA |
9.02 |
8.89 |
-1.44 |
-7.97 |