
Investment performance plays a crucial role in the funding of public pension plans. In fact, investment earnings have accounted for 63 percent of all public pension revenues since 1989. Because pre-funded pension plans project their costs based on these investment returns, it is also essential that public pension systems set accurate and realistic assumptions to avoid unforeseen increases in contributions.
On the aggregate level, public pension plans’ average investment returns over the last two decades have fallen short of their return assumptions. And this year’s recession has exacerbated this trend. While the stock market has, in many ways, recovered since April any market setback can have major and long-lasting effects for pension funds. Early reports of the current fiscal year’s investment performance from a number of pension plans show that 2020 investment return results will fall well below most pension plans’ assumptions, which adds to the growing trend of long-term results not matching expectations.
Assuming pension plans achieve a conservative 3 percent return in fiscal year 2019-2020, Reason Foundation Pension Integrity Project’s calculations show that the 20-year aggregate average rate of return would be only about 5.9 percent, falling far short of the current weighted average assumed rate of return of 7.25 percent.
In a perfect world, a defined benefit plan’s investment returns would perfectly match its assumed rate of return (ARR) so that the accumulated normal cost contributions and investment earnings would be enough to cover the promised benefits. However, the reality is far from perfect. Declining interest rates over the last three decades have made it harder for public pension plans to match their ARRs, which have remained relatively high.
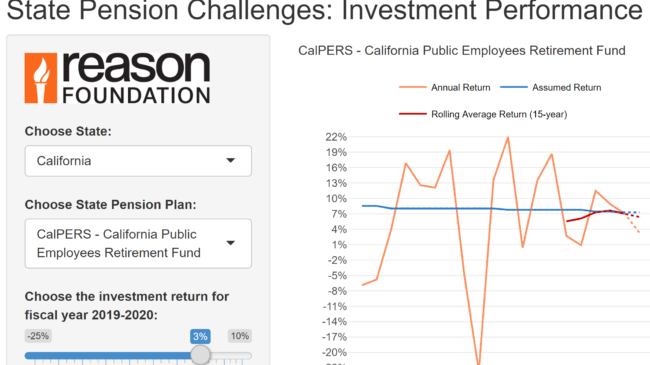
To visualize how a state pension plans’ historical performance has stacked up against their assumptions, Reason Foundation created this interactive visualization.
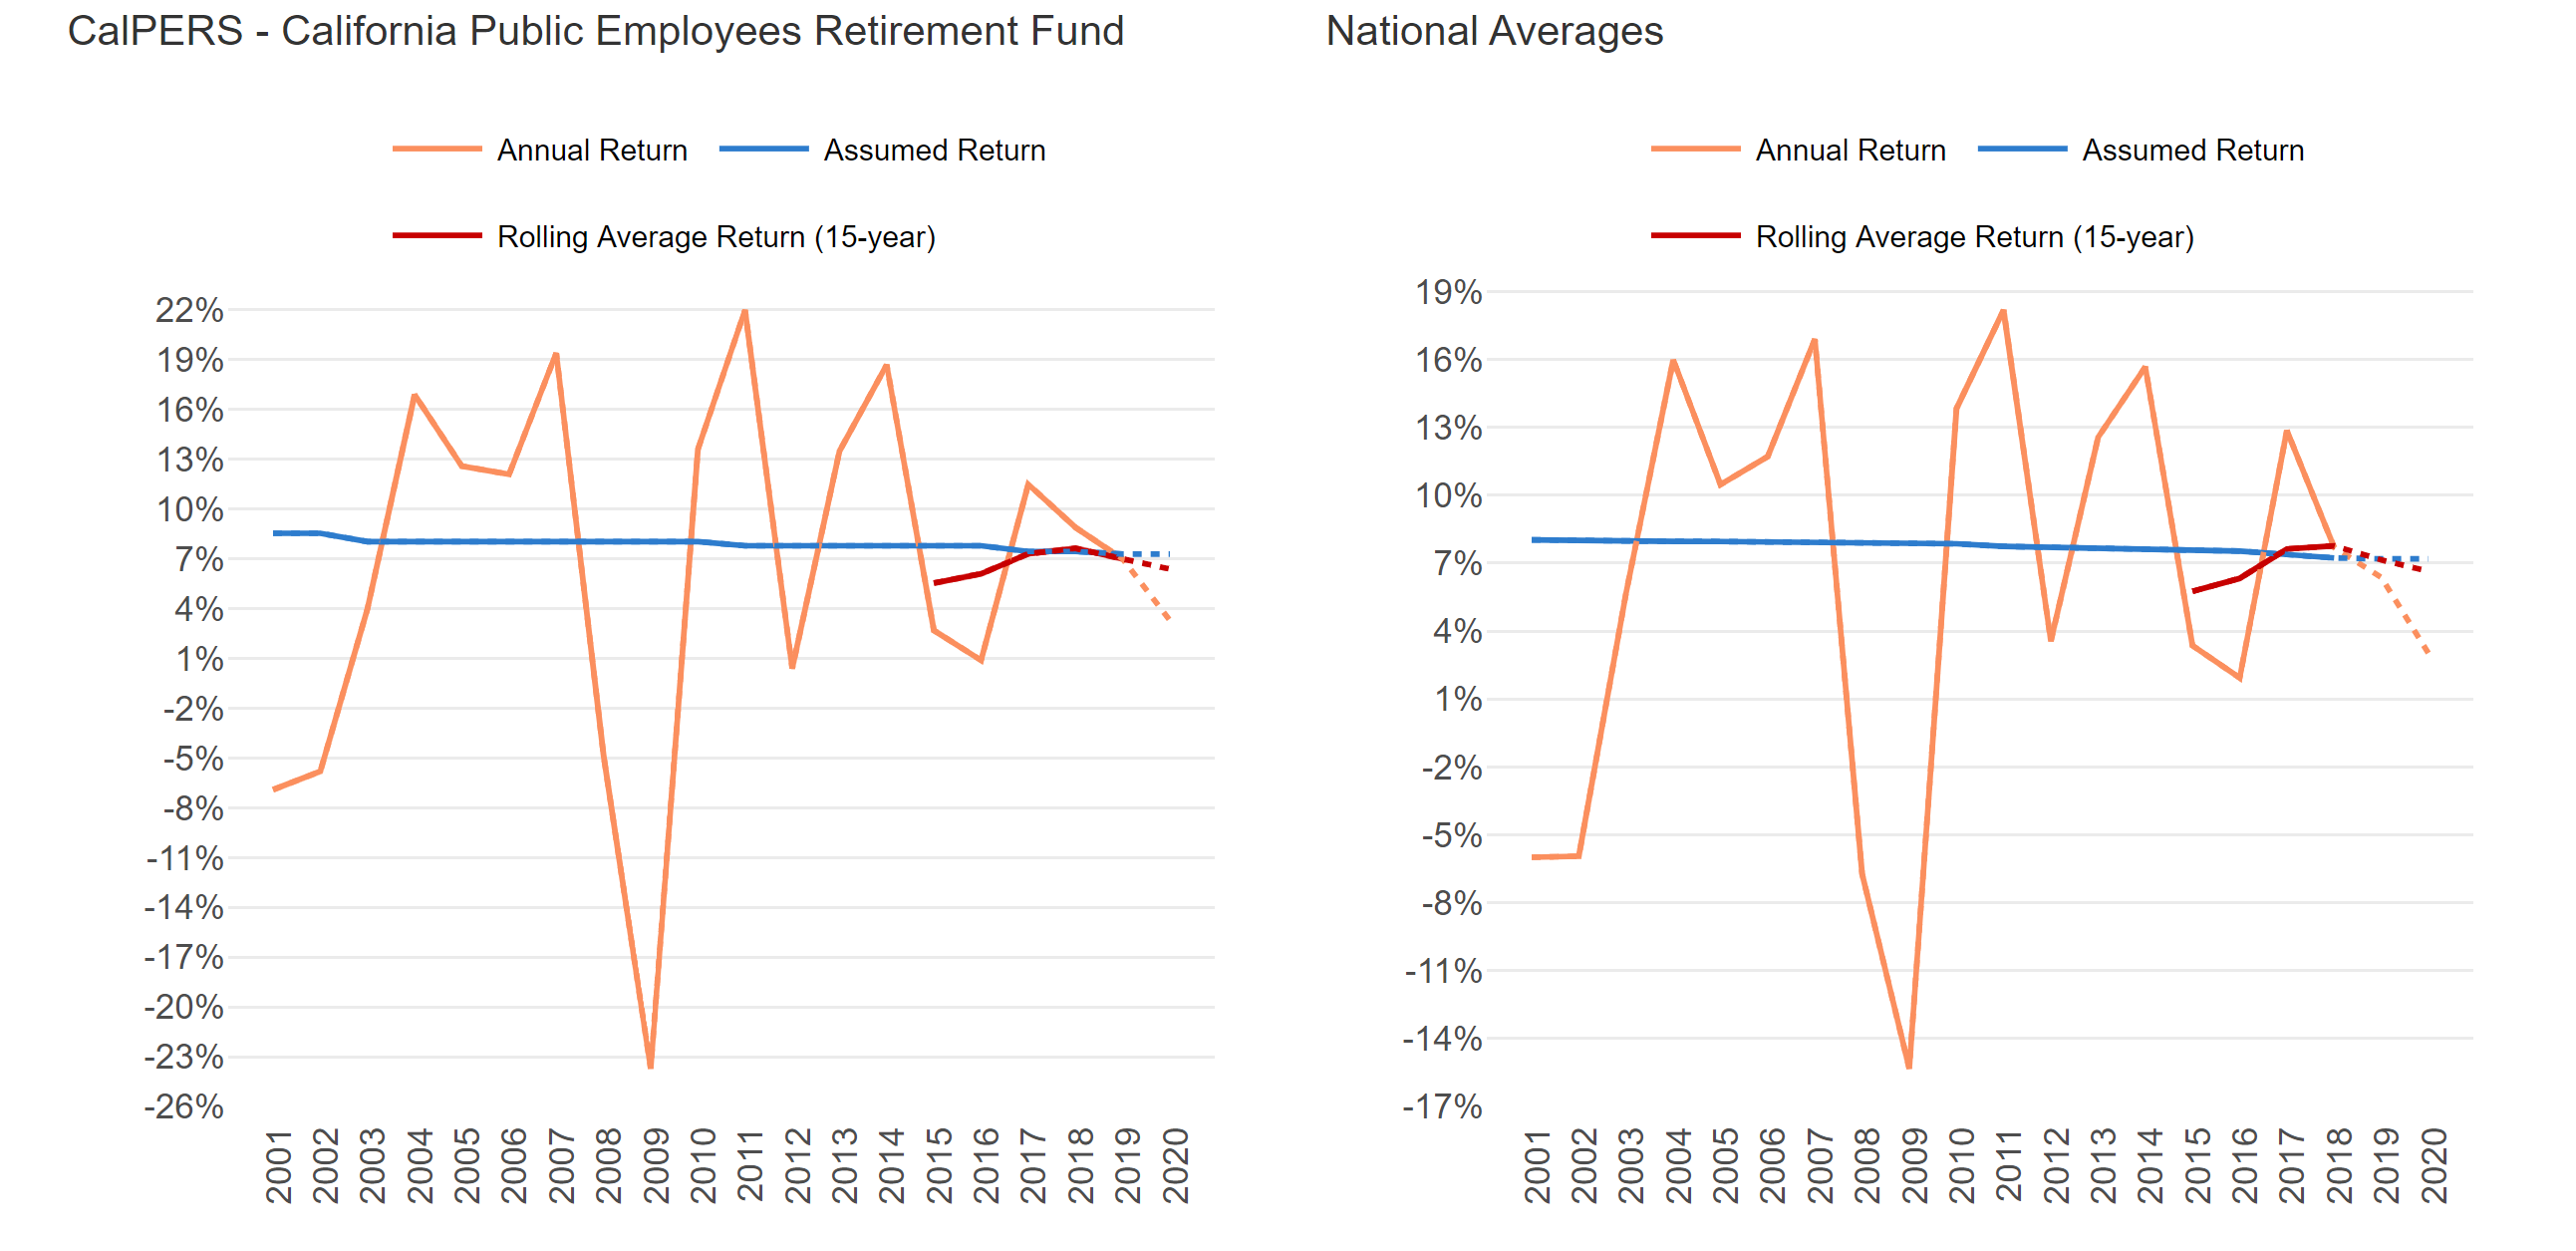
The first two charts below display historical annual returns, the ARR, and the rolling average return over the last two decades for the selected plan as compared to the national average.
Below you can see the results, excerpted from the tool, for the largest public pension plan in the nation, the California Public Employees Retirement System (CalPERS), with an estimated 3 percent return selected for the 2019-2020 fiscal year.
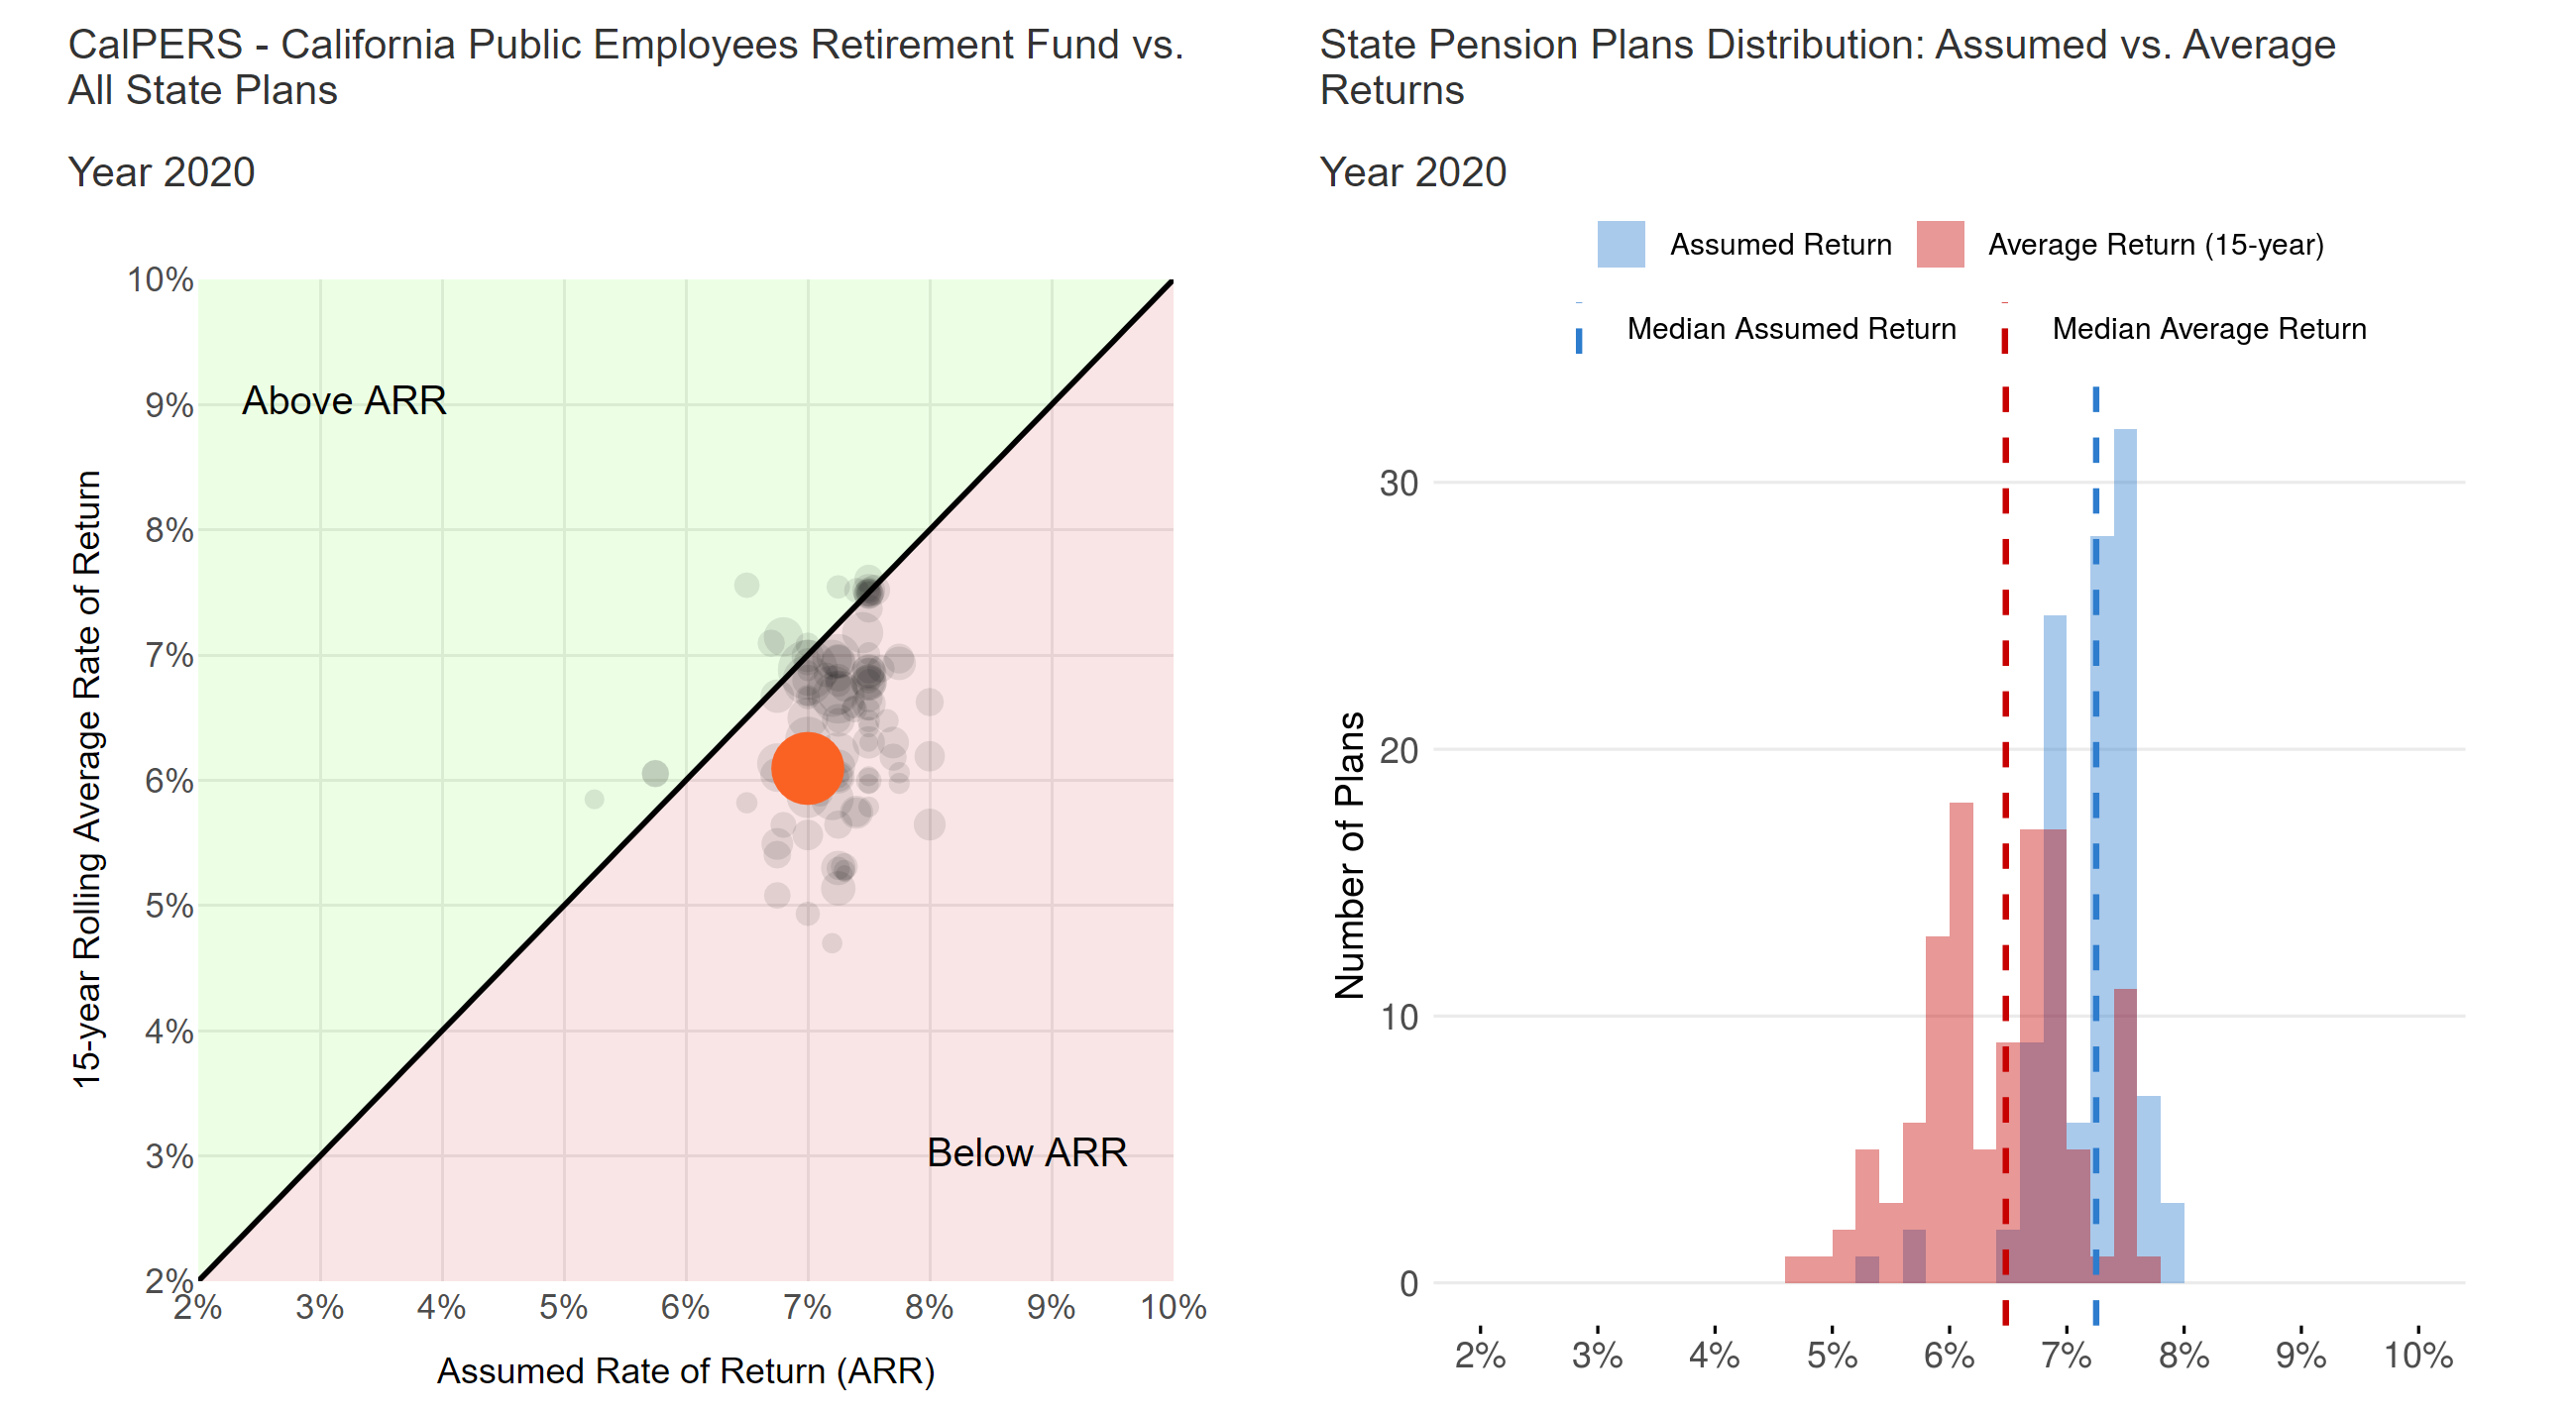
The last two charts show a snapshot of investment performance vs. assumed rate of return among 115 state pension plans in our database, in a year selected by the user. Users can see if their selected pension plan’s 15-year performance fell above or below expectations for any particular year, as well as how that result compares to other state plans.
We recommend viewing this interactive chart on a desktop for the best user experience.
Please note that the interactive tool will automatically sleep after a certain idle time and can be restarted by simply refreshing the page.