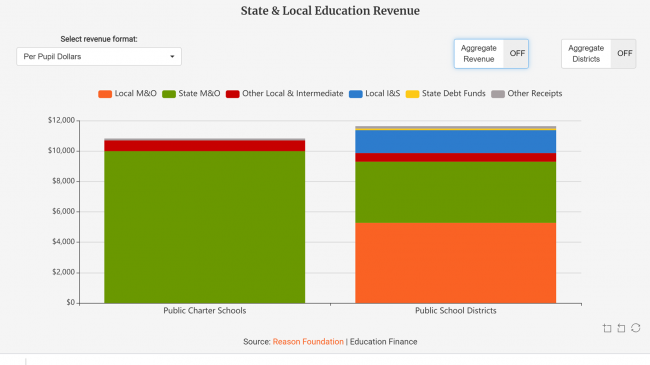
The number of students attending public charter schools and public school districts in Texas has grown. While education revenue for both sectors has increased, charters have received a disproportionately smaller amount of the additional education dollars.
In 2019, public charter schools received about $10,824 per pupil compared to $11,637 for public school districts, a funding disadvantage of $813 per pupil. Over the last five years, the funding gap has grown by almost 36 percent- from $596 to $813.
To help illustrate these trends and their importance to students, Reason Foundation’s education policy team created an interactive dashboard that uses statewide and metro school district data to allow users to examine important revenue and student demographic trends.
The new, interactive data dashboard is available here: Texas Charter School Funding Analysis. And you can also find a mobile-friendly version of the dashboard here: Texas Charter School Funding Analysis (mobile).
It is important to account for student demographics when evaluating how education dollars are allocated to Texas schools. Thus, the dashboard looks at important trends in student demographics, such as special education needs, low-income status, and limited English proficiency, which all have varying degrees of added educational costs.
The data show that statewide, public charter schools serve greater proportions of economically-disadvantaged and limited English proficiency students but a smaller proportion of special education students than public school districts.
Despite public charter students now accounting for about 5.8 percent of all Texas public school students in average daily attendance, they receive only 5.4 percent of all statewide education revenue.
You can find more information on Texas charter school funding, including revenue comparisons that control for cost factors such as location and student demographics here: Fiscal Explainer – Texas Charter School Funding Analysis
You can also find an infographic on Texas charter school funding here: Infographic – The Texas Charter Funding Gap


