

Public transit debates often rely on a simplified image of the ‘average transit rider.’ Public transportation is usually portrayed as a service used primarily by lower-income, transit-dependent urban residents with few transportation alternatives. But federal transit data suggest the national rider profile is far more varied than many political and policy debates assume.
Transit serves very different functions depending on the region and type of service being provided. In major metro areas, commuter rail and express bus services bring suburban workers into downtown job centers during rush hour.
In all regions, local bus networks function as essential day-to-day transportation for riders making shorter trips throughout the day.
These differences shape when people travel, how often they ride, which services they prioritize, and how agencies allocate resources.
The available national datasets also measure various aspects of transit ridership. The American Public Transportation Association’s (APTA) “Who Rides Public Transportation” survey provides one of the most comprehensive national pictures of transit rider characteristics and travel behavior, drawing on roughly 700,000 responses collected over eight years. The report reflects responses by transit trips, not individual persons, meaning that people who use transit more frequently are more likely to be captured in the survey and therefore have a larger influence on the national results. Because many of the nation’s largest transit systems also have the highest ridership, those systems tend to have a greater influence on the national profile.
Census Bureau data similarly show that transit commuters are heavily concentrated in a small number of transit-heavy metropolitan areas, particularly New York, Chicago, Los Angeles, Washington, Boston, Philadelphia, and San Francisco.
The Census Bureau’s “Commuting by Public Transportation in the United States: 2019” data focuses only on workers’ primary commute mode based on the method used for the longest distance traveled to work. However, the report provides a detailed picture of transit commuting patterns, regional variation, and demographic differences among users, even though it doesn’t capture non-work trips such as shopping, school, medical appointments, or other daily travel.
Even with differences in coverage and methodology, the available data challenge several common assumptions about who uses transit. According to the American Public Transportation Association (APTA), most transit riders are in their prime working years: 79% are between ages 25 and 64, 71% are employed, and another 7% are students. APTA also found that 77% of riders live in households with at least one worker.
Transit riders span a broad range of income levels, with 21% of transit-rider households earning less than $15,000 annually and another 21% earning more than $100,000. Census Bureau data show that those income patterns vary substantially by geography.
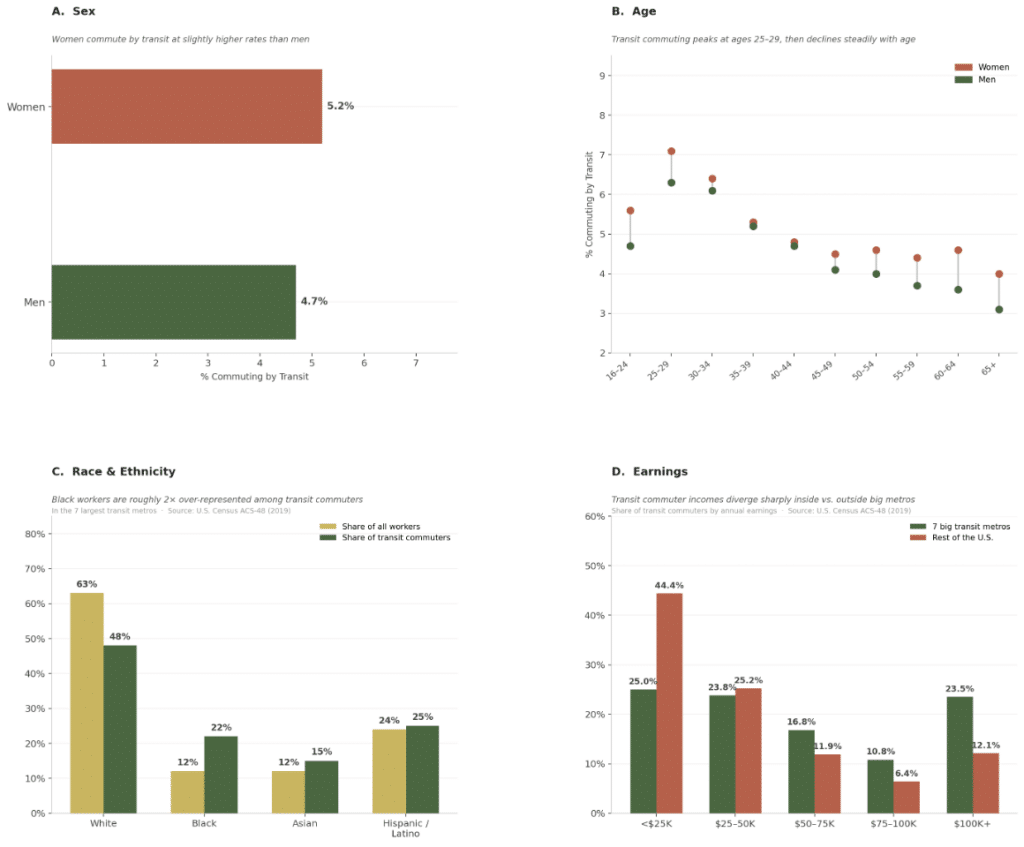
In the seven transit-heavy metropolitan areas, transit commuters are distributed across income groups, whereas outside those areas, they are much more likely to earn under $25,000 annually. Communities of color account for 60% of riders nationally, and women make up a slight majority at 55%. Figure 1 also shows that transit commuting rates are highest among workers ages 25 to 29 and generally decline with age.
Figure 1. Demographic dashboard of U.S. transit commuters across four dimensions.
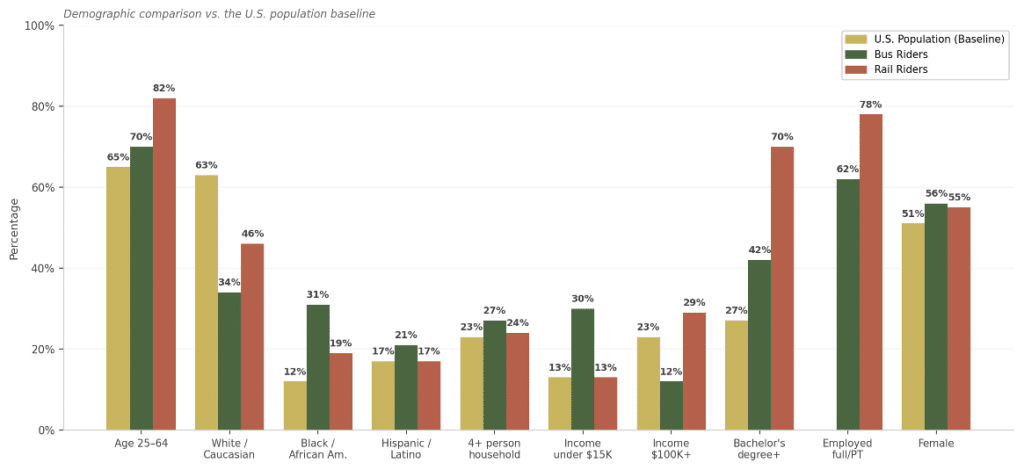
Bus and rail riders have different profiles, as shown in Figure 2.
Rail riders tend to have higher incomes and are more likely to be college-educated, while bus riders are more likely to have lower incomes and less access to a vehicle. Among rail riders, 70% have completed at least a bachelor’s degree or graduate education, compared with 42% of bus riders.
White riders make up 46% of rail riders but only 34% of bus riders, while black riders account for 31% of bus riders compared to 19% of rail riders.
Bus riders are also much more likely to report household incomes below $15,000 annually, while rail riders are far more likely to report household incomes above $100,000.
Figure 2. Bus and rail riders compared to the U.S. population across nine demographic measures.
Transit riders use public transportation for a variety of reasons. According to APTA, 44% of riders use transit for convenience, to avoid traffic, or because transit is faster than driving in busy city corridors. Another 16% use transit for economic reasons, such as reducing fuel or parking costs. The remaining 40% ride transit primarily because they lack access to a car or other transportation options.
One major limitation of the available national transit data is the lack of detailed information on paratransit riders. Federal law requires transit agencies operating fixed-route service to provide complementary Americans with Disabilities Act (ADA)-compliant paratransit for riders whose disabilities prevent them from using buses or rail systems independently. These services are often heavily used by older adults and riders traveling to medical appointments, dialysis treatment, rehabilitation, and other healthcare services. Yet major national transit datasets, including APTA’s “Who Rides Public Transportation” survey, provide no comparable national demographic profile of paratransit users relative to bus and rail users.
The federal data on rider demographics, travel behavior, and transit use have important implications for how transit agencies design and prioritize service. In busy commuter corridors where rail attracts more choice riders, agencies may benefit from adding express bus service and other improvements that make transit more competitive with driving. Bus systems serving more transit-dependent riders may instead benefit more from increasing all-day frequency, extending evening and weekend service, simplifying routes, improving transfers, and prioritizing reliability on major local corridors.
The data also suggest that agencies in less-dense areas should be cautious about expensive rail projects in low-ridership corridors and instead consider lower-cost options such as frequent bus service, bus rapid transit, express buses, microtransit, and demand-response service. Agencies must also prepare for the growing demand for ADA paratransit service as the population ages. Census Bureau projections show that one in five Americans will be age 65 or older by 2030, likely increasing demand for medical and other essential trips. Transit agencies in areas with large older populations may need to expand paratransit capacity and invest in more flexible demand-response services.
Instead of following a one-size-fits-all approach, transit agencies should align investments and service plans with riders’ actual travel patterns and needs in their regions.