

What matters more for pension fund investments, asset class returns or the asset allocations themselves?
Investment performance plays an important part in making sure that pension plans have enough money to pay pension benefits. For public plans in the U.S., investment returns are even more critical as most pension boards adopt excessively high assumed rates of return and discount rates, which artificially reduce actuarially required contributions. Such aggressively optimistic assumptions thus disproportionately enlarge the role of investment gains in funding benefits. Unfortunately, investment returns for public plans have failed to keep up with the high return assumptions, particularly since the onset of the Dot-com Crash in 2001, and returns differ significantly among plans.
A recent study by researchers at the Center for Retirement Research at Boston College (CRR) takes a look into the variation of returns to investigate why some plans perform better or worse than others. The study examines the period from 2001 to 2016, during which public plans earned an annualized return of 5.5 percent, well below the average return assumption of about 7.6 percent. The returns, however, are far from uniform. CRR finds that the top-quartile plans earned an average return of 6.3 percent, compared to the 4.6 percent average return earned by the bottom-quartile ones.
Size does not appear to be a leading factor in how well a public pension fund’s investments have performed. Larger plans do not perform better than smaller plans, as the top-quartile plans are noticeably smaller, on average, than those in the lower quartiles.
To dig into the question of what’s driving returns, the study looks at two factors: asset allocation and asset class returns. Asset allocation is about the proportions of asset classes invested. Those asset classes can be equities, fixed income, real estate, etc. Asset class returns are the investment returns earned within each of the invested asset classes — fund managers typically choose an optimized asset allocation that minimizes risk for a given expected return (or that maximizes expected return for a given risk level), then they’ll adopt specific investment strategies for each asset class to achieve the asset class’ target return. (According to the study, asset class returns are primarily a function of the manager selection of individual holdings within each asset class and/or fees.)
So how to assess how much each factor contributed to the differences in plan returns—in other words, how to discern the asset allocation effect from the asset class returns effect? The study’s authors construct a counterfactual scenario where plans in the three lower quartiles of overall performance mimic the average asset allocation of those plans in the top performance quartile, but while still retaining their own asset class returns. CRR then measures the investment returns those lower-quartile plans would have earned. Logically, the difference between those counterfactual returns and the actual returns earned by those lower-quartile plans represent the asset allocation effect. It also follows that the difference between those counterfactual returns and the actual returns earned by the top-quartile plans captures the effect of asset class returns specifically. The below chart summarizes the key findings from the study:
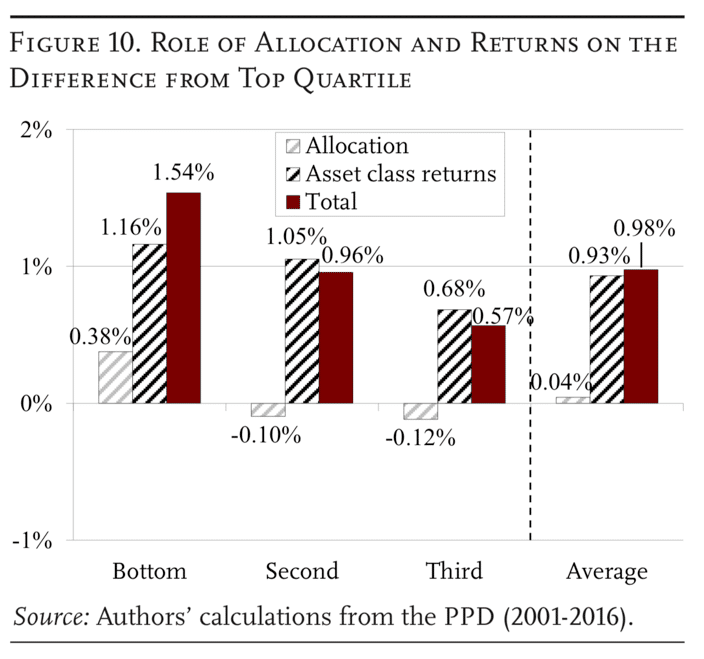
The chart shows that asset allocation explains only a small portion of the investment return differences between the bottom three quartiles of plans and the top performing quartile. Most of the differences are due to asset class returns.
As shown in the chart, asset allocation accounts for only 0.38 percentage points of the return difference between the top-quartile and the bottom-quartile plans. The rest, 1.16 percentage points, is attributed to asset class returns. Interestingly, the second-quartile and third-quartile plans would have performed worse if they had mimicked the top-quartile plans’ average asset allocation. Overall, it seems that the top-quartile plans’ superior investment returns relative to the lower-quartile plans has almost everything to do with asset class returns rather than asset allocation.
To be clear, the study’s findings do not imply that asset allocation doesn’t matter, a conclusion a casual reader may come to after seeing such a small asset allocation effect. The study’s findings are about the marginal effect of asset allocation on the return differences among public plans, not on the total returns earned by those plans. In fact, the main reason why the asset allocation effect is so small is probably because the plans already shared quite similar asset allocation over time, with shares of equities and fixed income declining and of alternatives increasing significantly for all the four quartiles during the 2001-2016 period. Since the differences in asset allocation are not significant, it makes sense that asset allocation plays a small role in explaining the return differences.
There may be one potential problem with the study’s methodology. To create the counterfactual scenarios to measure the effects of asset allocation and asset class returns, the study “separately tracks allocation and returns for seven broad asset classes: equities, fixed income, and five categories of alternatives – private equity, hedge funds, real estate, commodities, and other alternatives.”[1] These five categories, however, seem too broad, especially equities and fixed income. The equities asset class comprises smaller common asset classes such as domestic small-cap equities, domestic large-cap equities, international developed equities, and emerging market equities. Inside fixed income, we have government bonds, corporate bonds, emerging market bonds, high yields, etc. Small cap equities and emerging market equities tend to have higher expected returns and risk. Similarly, high yields and emerging market bonds are typically riskier than government bonds and investment grade debts.
That means plans that have the same share of equities or fixed income may earn significantly different returns for the asset class if their allocations of smaller asset classes within the broad asset category are radically different. If plan A’s equities earned a higher return than plan B’s equities because plan A invested more in small-cap and emerging market equities, should the return difference between plan A and B be attributed to “asset allocation” or “asset class returns”? If we assume that asset class returns are a function of selecting individual assets and/or fees, it seems more reasonable to attribute the aforementioned return difference to asset allocation. The authors note the issue in the study’s endnotes:
“When assessing the impact of allocation and returns, a key consideration is how narrowly or broadly to define asset classes. If an asset class is defined too broadly, then differences in returns within an asset class may actually reflect differences in allocation. On the other hand, defining an asset class too narrowly risks making the asset too unique for comparison.”[2]
Though the authors are aware of the problem, their selection of the broad asset classes doesn’t exactly solve it. This is probably because of lack of data.
The previous caveat aside, the study still offers an important insight: looking at only the broad asset allocation won’t lend us much confidence in assessing a pension plan’s investment performance relative to its peers. One has to dig deeper into these broad asset classes to analyze its investment returns, whether historically or prospectively.
[1] See endnote #15 of the study
[2] Ibid