
California’s state-controlled highway system continues to struggle in performance and cost-effectiveness when compared to other states across the country. For the second straight year, California’s highways rank 43rd in the nation in overall cost-effectiveness and condition, according to Reason Foundation’s 25th Annual Highway Report.
The Annual Highway Report measures the condition and cost-effectiveness of state-controlled highways in 13 categories, including pavement condition, traffic congestion, structurally deficient bridges, traffic fatalities, and spending per mile.
California is in the bottom 10 states in six of the report’s 13 total categories. Compared to neighboring states, the report finds California’s overall highway performance is much worse than Arizona (ranks 23rd overall), Nevada (ranks 27th), and Oregon (28th). California can take some solace in the fact it is doing better than some other highly populated states, primarily New York (ranks 44th overall) and New Jersey (ranks last, 50th).
But California’s drivers and taxpayers are getting worse highway conditions at higher costs than drivers in other comparable states, especially Texas, which ranks 18th overall in performance in cost-effectiveness. Despite having several of the largest metropolitan areas in the country—Dallas, Houston, San Antonio, Austin, and El Paso—drivers in Texas waste fewer hours stuck in urban traffic congestion than Californians. Texas also manages to deliver better pavement conditions while spending far less money per mile than California.
Unfortunately, the summary of California’s highway system is that it has high-costs per mile, long traffic jams, and bumpy roads. The state ranks 44th in urban Interstate pavement condition and 41st in rural Interstate pavement condition. If there’s a category that could be most quickly addressed by state leaders, it’s pavement condition. Prioritizing maintenance to ensure roads are repaired and maintained on-schedule should be an increased focus of state and metro transportation officials.
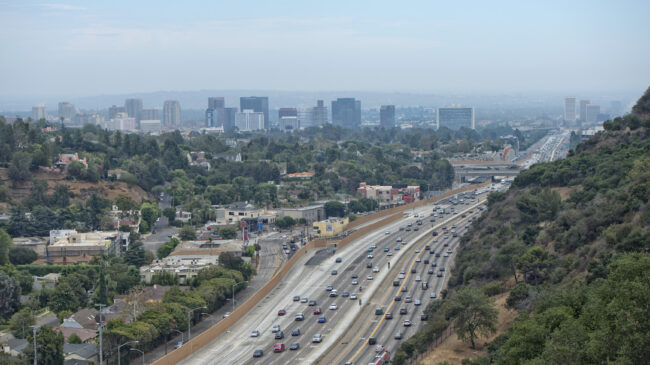
With Southern California’s legendary traffic jams, it’s not a surprise that California has some of the nation’s worst gridlock, ranking 45th in the country in terms of traffic congestion delays. The average California commuter spent 62.5 hours sitting in traffic delays during 2019. Some of the most congested trouble spots in Southern California are I-10 between Santa Monica and downtown Los Angeles; SR 91 between Orange and Riverside counties; and I-405 between I-10 and US 101. Each of these highway segments is congested for multiple hours every day.
When it comes to spending, California spent over $600,000 per state-controlled mile of highway in 2018. Some of those high costs can be attributed to the cost-of-living in the state, along with rules and regulations that drive up project and labor costs. And the good news is that California’s total highway costs are less per mile than a few other states, including Florida, which spent over $800,000 per mile, and New Jersey’s nation-high spending figure of over $2 million per state-owned mile of highway.
Less positively, California spends more money on administrative costs per mile of state-controlled highway than all but three other states. If state leaders are looking—and they should be— to make California’s highway spending more efficient and effective, Texas and Virginia are among the states that have far larger state-controlled highway systems than California but still manage to do a far better job at limiting their overhead costs and improving pavement conditions.
Importantly, California’s best ranking comes in its overall traffic fatality rate, where it ranks 18th out 50 states, with 1.02 fatalities per 100 million vehicle-miles traveled.
The state’s percentage of bridges that are structurally deficient are also better than the national average, ranking 24th out of 50 states. Just over seven percent of California’s bridges are structurally deficient, which is far better than states like West Virginia, Rhode Island, and Iowa where over 19 percent of their bridges are structurally deficient.
California needs to build on those bright spots and make progress in the overall cost-effectiveness and performance rankings. To do so, California needs to better prioritize high-value projects and ongoing maintenance to improve its pavement conditions, reduce its urban area traffic congestion, and reduce its administrative costs.
A version of this column previously appeared in the Los Angeles Daily News.