

The Centers for Disease Control and Prevention recently released 2017 state-level mortality data. Over the last year, drug overdose trends grew more severe and will likely be a major topic of political and policy-making discourse. There were 70,237 total drug overdose deaths and 47,600 opioid overdose deaths in 2017. Total drug overdose and opioid overdose death rates increased 9 percent and 11 percent respectively over the 2016 totals. They have increased 257 percent and 400 percent respectively since 1999, according to CDC data.
Fentanyl remains the leading cause of overdose deaths and is disproportionately responsible for the increase in drug overdose rates from 2016. Fentanyl is a synthetic opioid that is up to 100 times stronger than morphine and is often produced and mailed in from China. Fentanyl was found in 40 percent of drug overdose deaths in 2017, up from 30 percent in 2016. Fentanyl or heroin was found in 51 percent of the total drug overdose deaths and 75 percent of opioid overdose deaths in 2017, up from 45 percent and 68 percent respectively in 2016.
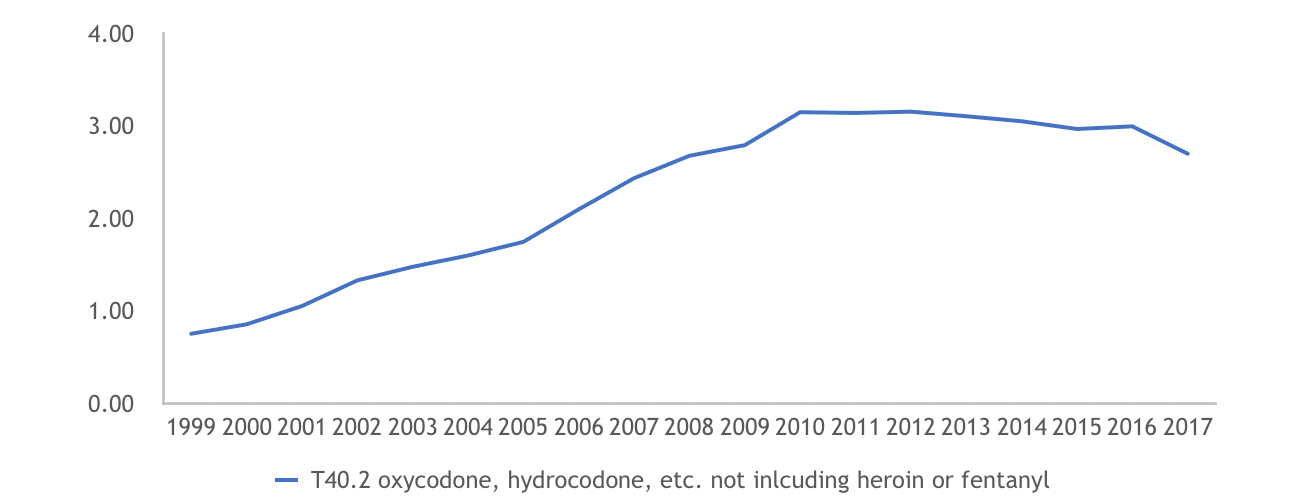
In 2017, natural and semisynthetic opioid (prescriptions like oxycodone and hydrocodone) death rates that did not involve heroin or fentanyl decreased 9 percent from 2016. The cocaine-related death rate increased 33 percent from 2016 to 2017, but this is likely due to fentanyl adulteration, which was found in 52 percent of cocaine-related overdose victims, up from 40 percent compared to 2016. The cocaine overdose death rate with no fentanyl reported increased 7 percent from 2016.
These phenomena can be mostly attributed to the increased use of black-market opioids. Pennsylvania had the most drug overdose deaths in 2017, at 5,388 (37 percent fentanyl, 78 percent fentanyl for opioid overdose deaths), Ohio had the most opioid overdose deaths at 4,293 (82 percent fentanyl, 69 percent fentanyl for all drug deaths), and West Virginia had both the highest rates of total drug overdose deaths and opioid overdose deaths at 53.6 and 45.9 people per 100,000 respectively.
Below are the complete rankings of states and Washington, D.C., by total drug overdose deaths, opioid overdose deaths, total drug overdose death rates, and opioid overdose death rates according to CDC data. 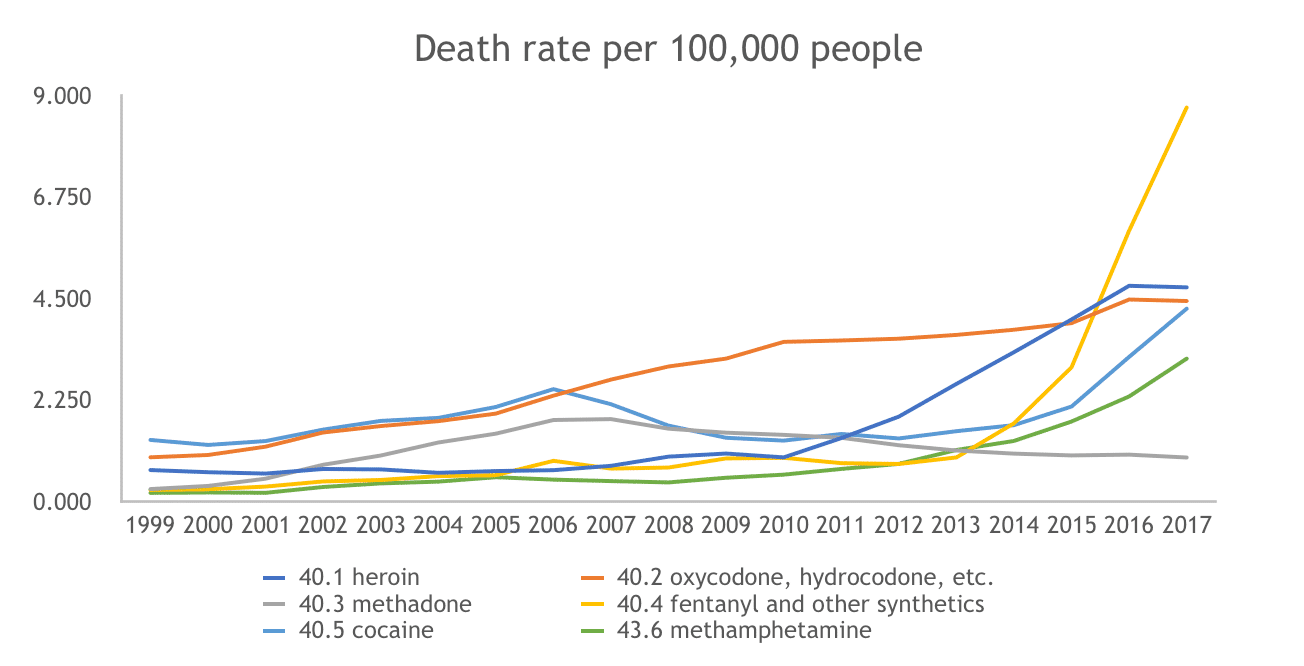
(Figures are not mutually exclusive.)
States Ranked by Total Drug Overdoses
| Rank | State | Total Drug Overdoses | Percent Involving Fentanyl |
|---|---|---|---|
| US | 70237 | 40% | |
| 1 | Pennsylvania | 5388 | 37% |
| 2 | Ohio | 5111 | 69% |
| 3 | Florida | 5088 | 42% |
| 4 | California | 4868 | 11% |
| 5 | New York | 3921 | 57% |
| 6 | Texas | 2989 | 12% |
| 7 | Illinois | 2778 | 45% |
| 8 | Michigan | 2694 | 51% |
| 9 | New Jersey | 2685 | 51% |
| 10 | North Carolina | 2414 | 53% |
| 11 | Maryland | 2247 | 69% |
| 12 | Massachusetts | 2168 | 76% |
| 13 | Indiana | 1852 | 35% |
| 14 | Tennessee | 1776 | 33% |
| 15 | Kentucky | 1566 | 50% |
| 16 | Georgia | 1537 | 27% |
| 17 | Arizona | 1532 | 17% |
| 18 | Virginia | 1507 | 55% |
| 19 | Missouri | 1367 | 45% |
| 20 | Wisconsin | 1177 | 40% |
| 21 | Washington | 1169 | 12% |
| 22 | Louisiana | 1108 | 14% |
| 23 | Connecticut | 1072 | 64% |
| 24 | Colorado | 1015 | 11% |
| 25 | South Carolina | 1008 | 40% |
| 26 | West Virginia | 974 | 63% |
| 27 | Alabama | 835 | 24% |
| 28 | Oklahoma | 775 | 13% |
| 29 | Minnesota | 733 | 25% |
| 30 | Nevada | 676 | 10% |
| 31 | Utah | 650 | 14% |
| 32 | Oregon | 530 | 16% |
| 33 | New Mexico | 493 | 15% |
| 34 | New Hampshire | 467 | 80% |
| 35 | Arkansas | 446 | 15% |
| 36 | Maine | 424 | 66% |
| 37 | Mississippi | 354 | 23% |
| 38 | Iowa | 341 | 27% |
| 39 | Delaware | 338 | 53% |
| 40 | Kansas | 333 | 10% |
| 41 | Rhode Island | 320 | 63% |
| 42 | District of Columbia | 310 | 59% |
| 43 | Idaho | 236 | 9% |
| 44 | Hawaii | 203 | 3% |
| 45 | Nebraska | 152 | 16% |
| 46 | Alaska | 147 | 25% |
| 47 | Vermont | 134 | 57% |
| 48 | Montana | 119 | 5% |
| 49 | South Dakota | 73 | 19% |
| 50 | Wyoming | 69 | 25% |
| 51 | North Dakota | 68 | 18% |
States ranked by Opioid Overdoses
| Rank | State | Opioid Overdoses | Percent Involving Fentanyl |
|---|---|---|---|
| US | 47600 | 75% | |
| 1 | Ohio | 4293 | 82% |
| 2 | Florida | 3245 | 66% |
| 3 | New York | 3224 | 69% |
| 4 | Pennsylvania | 2548 | 78% |
| 5 | Illinois | 2202 | 57% |
| 6 | California | 2199 | 24% |
| 7 | Michigan | 2033 | 67% |
| 8 | Maryland | 1985 | 78% |
| 9 | New Jersey | 1969 | 70% |
| 10 | North Carolina | 1953 | 66% |
| 11 | Massachusetts | 1913 | 86% |
| 12 | Texas | 1458 | 24% |
| 13 | Tennessee | 1269 | 46% |
| 14 | Virginia | 1241 | 67% |
| 15 | Indiana | 1176 | 55% |
| 16 | Kentucky | 1160 | 67% |
| 17 | Georgia | 1014 | 41% |
| 18 | Connecticut | 955 | 72% |
| 19 | Missouri | 952 | 65% |
| 20 | Arizona | 928 | 29% |
| 21 | Wisconsin | 926 | 50% |
| 22 | West Virginia | 833 | 74% |
| 23 | South Carolina | 749 | 54% |
| 24 | Washington | 742 | 19% |
| 25 | Colorado | 578 | 19% |
| 26 | Utah | 456 | 20% |
| 27 | New Hampshire | 424 | 88% |
| 28 | Alabama | 422 | 47% |
| 29 | Minnesota | 422 | 44% |
| 30 | Louisiana | 415 | 38% |
| 31 | Nevada | 412 | 16% |
| 32 | Oklahoma | 388 | 26% |
| 33 | Maine | 360 | 77% |
| 34 | Oregon | 344 | 25% |
| 35 | New Mexico | 332 | 23% |
| 36 | Rhode Island | 277 | 73% |
| 37 | Delaware | 250 | 71% |
| 38 | District of Columbia | 244 | 75% |
| 39 | Iowa | 206 | 45% |
| 40 | Arkansas | 188 | 36% |
| 41 | Mississippi | 185 | 44% |
| 42 | Kansas | 144 | 22% |
| 43 | Vermont | 114 | 68% |
| 44 | Idaho | 103 | 21% |
| 45 | Alaska | 102 | 36% |
| 46 | Nebraska | 59 | 42% |
| 47 | Hawaii | 53 | 13% |
| 48 | Montana | 38 | 16% |
| 49 | North Dakota | 35 | 34% |
| 50 | South Dakota | 35 | 40% |
| 51 | Wyoming | 47 | 36% |
States Ranked by Total Drug Overdose Rate
| Year | State | Total Drug Overdose Rate | Percent Involving Fentanyl |
|---|---|---|---|
| US | 21.5 | 40% | |
| 1 | West Virginia | 53.6 | 63% |
| 2 | District of Columbia | 44.7 | 59% |
| 3 | Ohio | 43.8 | 69% |
| 4 | Pennsylvania | 42.1 | 37% |
| 5 | Maryland | 37.1 | 69% |
| 6 | Kentucky | 35.2 | 50% |
| 7 | Delaware | 35.1 | 53% |
| 8 | New Hampshire | 34.8 | 80% |
| 9 | Maine | 31.7 | 66% |
| 10 | Massachusetts | 31.6 | 76% |
| 11 | Rhode Island | 30.2 | 63% |
| 12 | Connecticut | 29.9 | 64% |
| 13 | New Jersey | 29.8 | 51% |
| 14 | Indiana | 27.8 | 35% |
| 15 | Michigan | 27.0 | 51% |
| 16 | Tennessee | 26.4 | 33% |
| 17 | Florida | 24.2 | 42% |
| 18 | Louisiana | 23.7 | 14% |
| 19 | New Mexico | 23.6 | 15% |
| 20 | North Carolina | 23.5 | 53% |
| 21 | Nevada | 22.5 | 10% |
| 22 | Missouri | 22.4 | 45% |
| 23 | Arizona | 21.8 | 17% |
| 24 | Illinois | 21.7 | 45% |
| 25 | Vermont | 21.5 | 57% |
| 26 | Utah | 21.0 | 14% |
| 27 | Wisconsin | 20.3 | 40% |
| 28 | South Carolina | 20.1 | 40% |
| 29 | Alaska | 19.9 | 25% |
| 30 | New York | 19.8 | 57% |
| 31 | Oklahoma | 19.7 | 13% |
| 32 | Colorado | 18.1 | 11% |
| 33 | Virginia | 17.8 | 55% |
| 34 | Alabama | 17.1 | 24% |
| 35 | Washington | 15.8 | 12% |
| 36 | Arkansas | 14.8 | 15% |
| 37 | Georgia | 14.7 | 27% |
| 38 | Hawaii | 14.2 | 3% |
| 39 | Idaho | 13.7 | 9% |
| 40 | Minnesota | 13.1 | 25% |
| 41 | Oregon | 12.8 | 16% |
| 42 | California | 12.3 | 11% |
| 43 | Wyoming | 11.9 | 25% |
| 44 | Mississippi | 11.9 | 23% |
| 45 | Kansas | 11.4 | 10% |
| 46 | Montana | 11.3 | 5% |
| 47 | Iowa | 10.8 | 27% |
| 48 | Texas | 10.6 | 12% |
| 49 | North Dakota | 9.0 | 18% |
| 50 | South Dakota | 8.4 | 19% |
| 51 | Nebraska | 7.9 | 16% |
States Ranked by Opioid Overdose Rate
| Rank | State | Opioid Overdose Rate | Percent Involving Fentanyl |
|---|---|---|---|
| US | 14.6 | 75% | |
| 1 | West Virginia | 45.9 | 74% |
| 2 | Ohio | 36.8 | 82% |
| 3 | District of Columbia | 35.2 | 75% |
| 4 | Maryland | 32.8 | 78% |
| 5 | New Hampshire | 31.6 | 88% |
| 6 | Massachusetts | 27.9 | 86% |
| 7 | Maine | 26.9 | 77% |
| 8 | Connecticut | 26.6 | 72% |
| 9 | Rhode Island | 26.1 | 73% |
| 10 | Kentucky | 26.0 | 67% |
| 11 | Delaware | 26.0 | 71% |
| 12 | New Jersey | 21.9 | 70% |
| 13 | Michigan | 20.4 | 67% |
| 14 | Pennsylvania | 19.9 | 78% |
| 15 | North Carolina | 19.0 | 66% |
| 16 | Tennessee | 18.9 | 46% |
| 17 | Vermont | 18.3 | 68% |
| 18 | Indiana | 17.6 | 55% |
| 19 | Illinois | 17.2 | 57% |
| 20 | New York | 16.2 | 69% |
| 21 | Wisconsin | 16.0 | 50% |
| 22 | New Mexico | 15.9 | 23% |
| 23 | Missouri | 15.6 | 65% |
| 24 | Florida | 15.5 | 66% |
| 25 | South Carolina | 14.9 | 54% |
| 26 | Utah | 14.7 | 20% |
| 27 | Virginia | 14.7 | 67% |
| 28 | Alaska | 13.8 | 36% |
| 29 | Nevada | 13.7 | 16% |
| 30 | Arizona | 13.2 | 29% |
| 31 | Colorado | 10.3 | 19% |
| 32 | Washington | 10.0 | 19% |
| 33 | Oklahoma | 9.9 | 26% |
| 34 | Georgia | 9.7 | 41% |
| 35 | Louisiana | 8.9 | 38% |
| 36 | Alabama | 8.7 | 47% |
| 37 | Oregon | 8.3 | 25% |
| 38 | Wyoming | 8.1 | 36% |
| 39 | Minnesota | 7.6 | 44% |
| 40 | Iowa | 6.5 | 45% |
| 41 | Arkansas | 6.3 | 36% |
| 42 | Mississippi | 6.2 | 44% |
| 43 | Idaho | 6.0 | 21% |
| 44 | California | 5.6 | 24% |
| 45 | Texas | 5.2 | 24% |
| 46 | Kansas | 4.9 | 22% |
| 47 | North Dakota | 4.6 | 34% |
| 48 | South Dakota | 4.0 | 40% |
| 49 | Hawaii | 3.7 | 13% |
| 50 | Montana | 3.6 | 16% |
| 51 | Nebraska | 3.1 | 42% |