Main Report Page
-
Annual Highway Report: Ranking each state’s highway conditions and cost-effectiveness
The Annual Highway Report examines every state's pavement and bridge conditions, traffic fatalities, congestion delays, spending per mile, administrative costs, and more.
-
25th Annual Highway Report
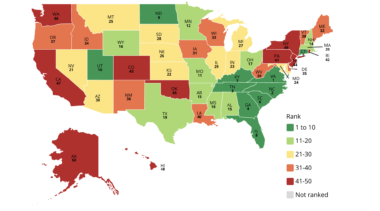
The 25th Annual Highway Report measures the condition and cost-effectiveness of state-controlled highways in 13 categories, including pavement condition, traffic congestion, fatalities, and spending per mile.
-
24th Annual Highway Report
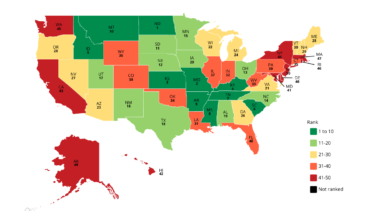
North Dakota, Virginia and Missouri have the best performing, most cost-efficient state highway systems, while New Jersey, Rhode Island and Hawaii have the worst.
-
23rd Annual Highway Report
Ranking each state's highway system in 11 categories, including highway spending, pavement and bridge conditions, traffic congestion, and fatality rates.
-
22nd Annual Highway Report
Annual Highway Report finds 40 states now have traffic delays that cost drivers at least 20 hours per year; states made progress on deficient bridges; state highway spending decreased slightly; and pavement conditions worsened marginally.
-
21st Annual Highway Report
State highways show small progress in deficient bridges and pavement condition, but states struggle to make significant road improvements
-
20th Annual Highway Report
State-by-state highway performance and cost-effectiveness rankings
-
19th Annual Highway Report
The Performance of State Highway Systems (1984-2008)
-
18th Annual Highway Report
The Performance of State Highway Systems (1984-2007)
-
17th Annual Highway Report
Policy Study 369
-
16th Annual Highway Report
Policy Study 360
