For centuries, experts have been trying to discover why some places are so rich and others so poor. Some economists suggest that a largely unregulated system leaves individuals maximally free to pursue their own plans, spurring entrepreneurial activity and innovation.
About 30 years ago, Nobel Laureate economists Milton Friedman, Gary Becker, and Douglas North, as well as a host of other economists and public policy experts, began an effort to quantify how free the economies of individual nations were. About 10 years later, that resulted in the production of the first Economic Freedom of the World report, and later a state-level version: Economic Freedom of North America (EFNA), which is now produced annually.
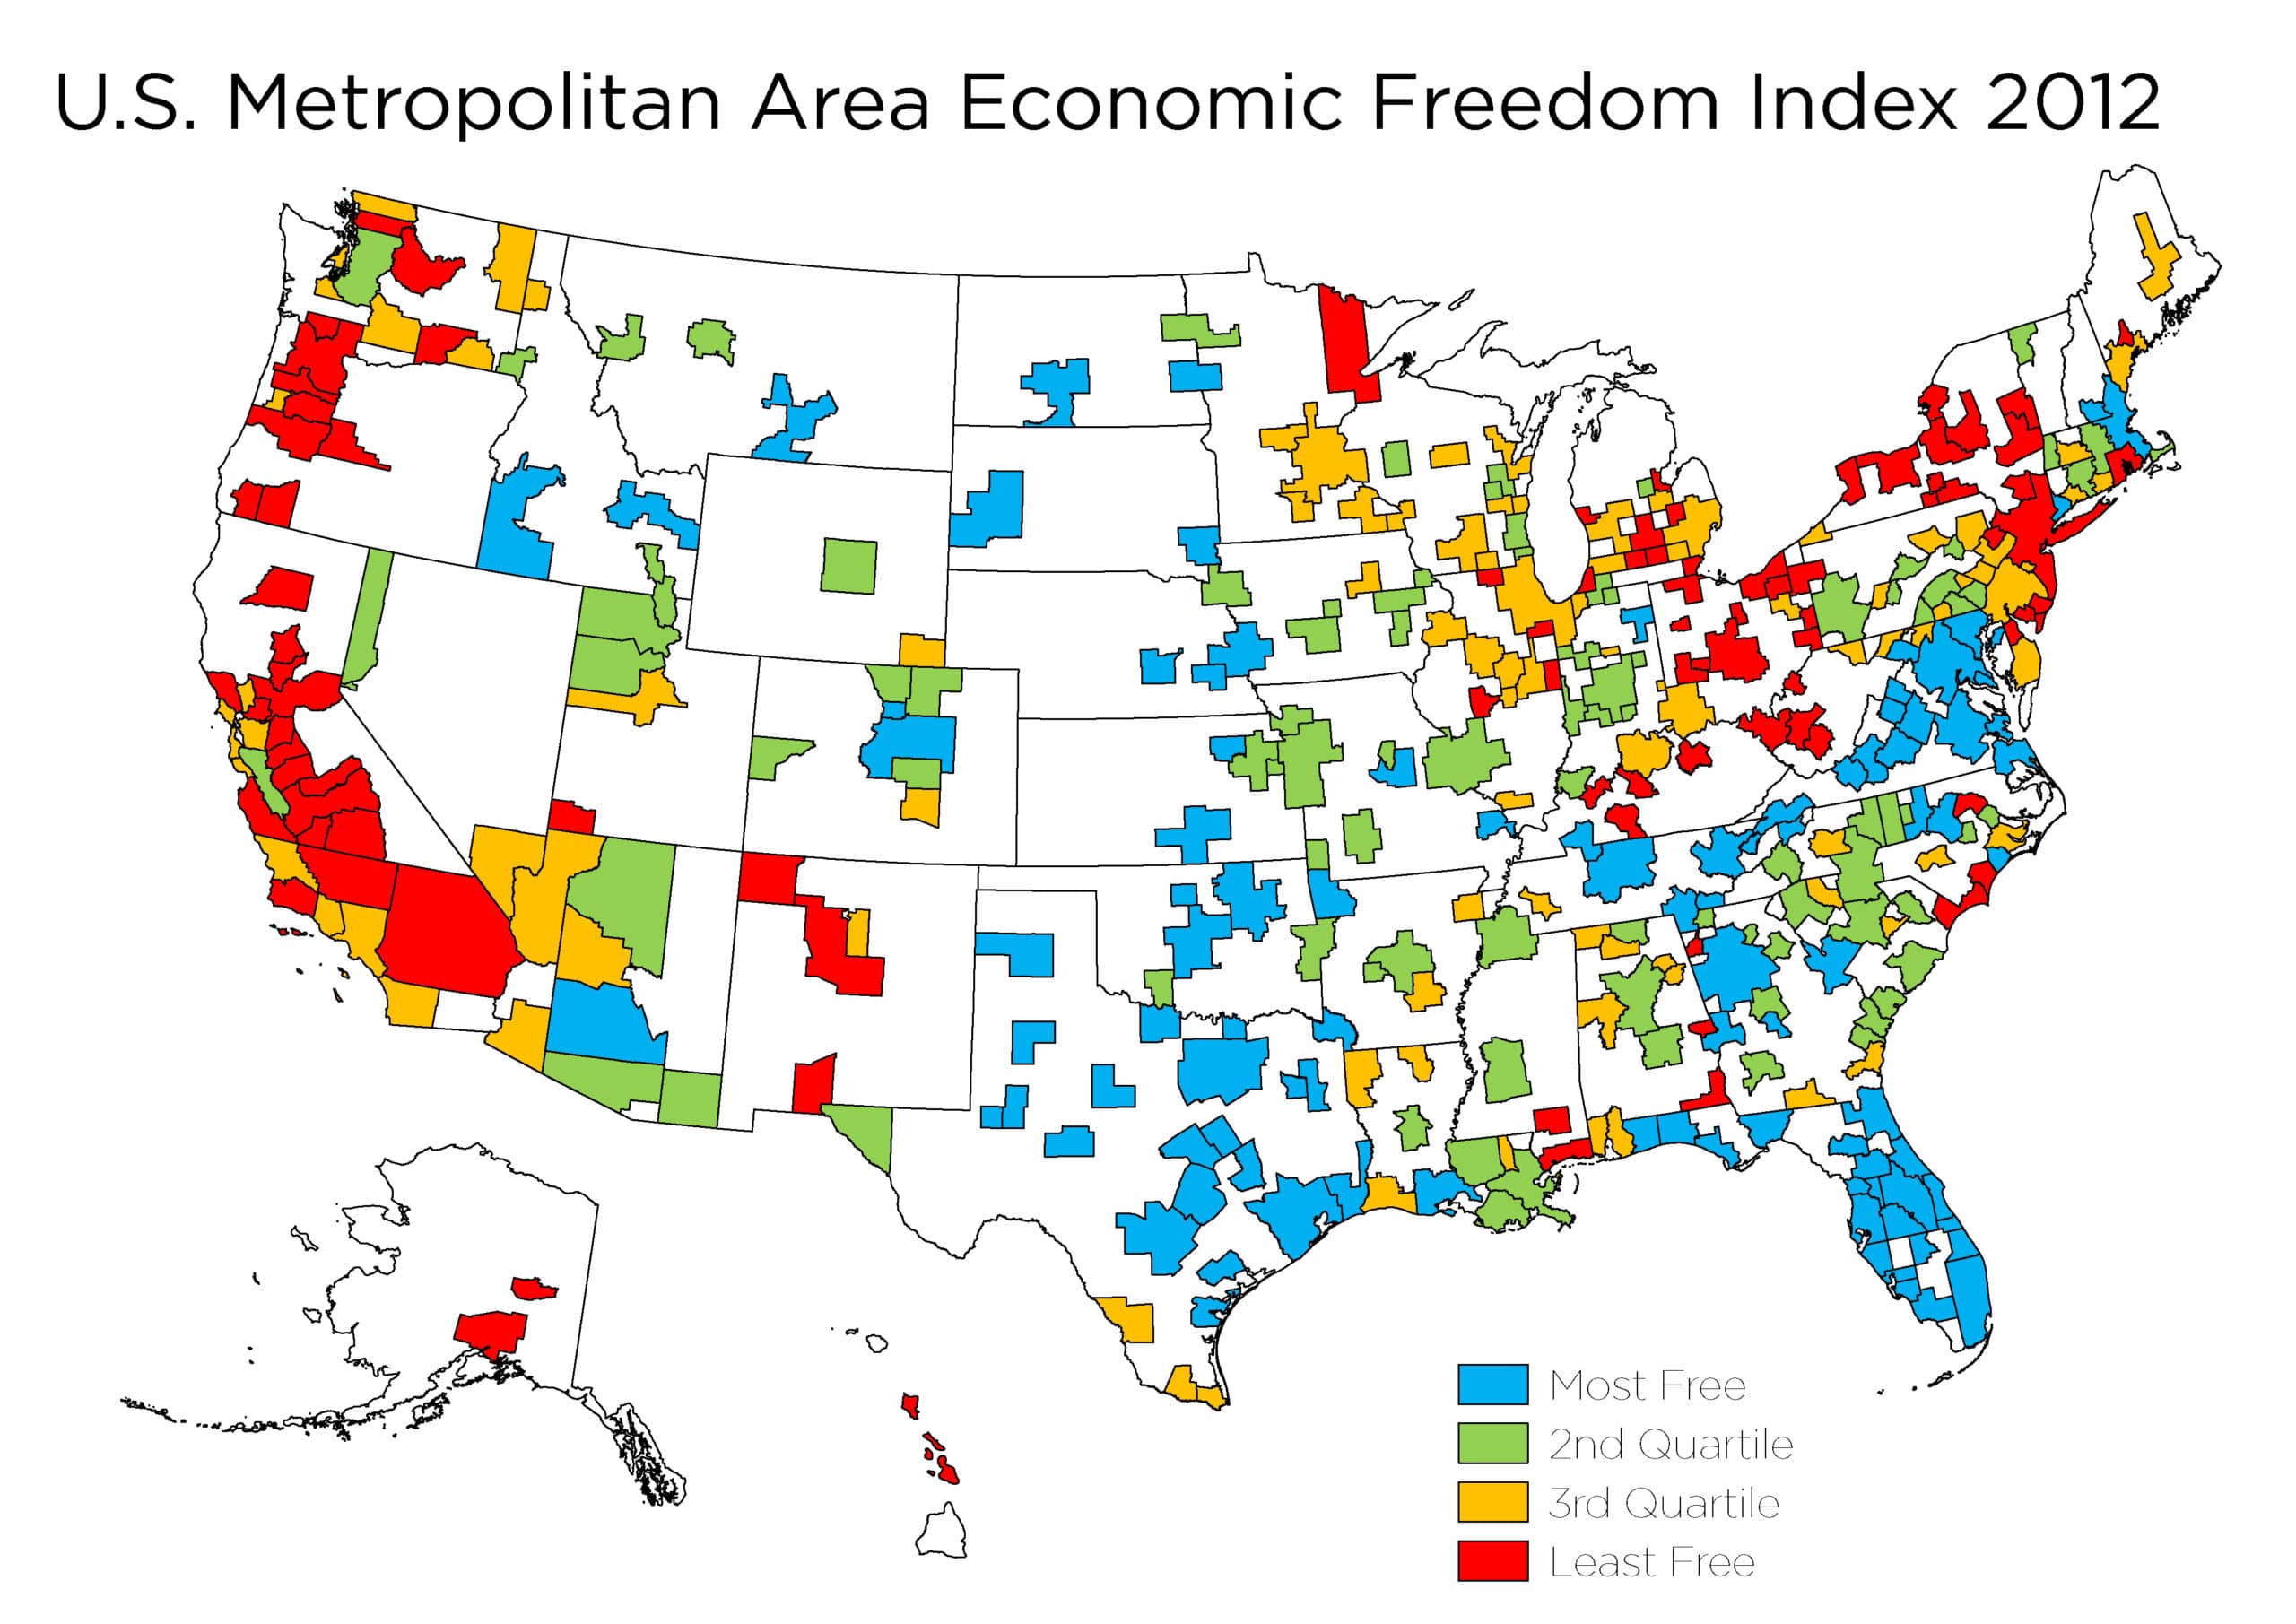
That state-level index shows us how the level of economic freedom can vary across sub-national jurisdictions within the same country (e.g., Texas and Florida have less- burdensome economic policies and therefore much greater economic freedom than New York and California). However, levels of economic freedom can also vary within those subnational jurisdictions. For example, the San Jose metro area has substantially higher economic freedom than Los Angeles. The same is true for Nashville compared to Memphis. In some places, metropolitan areas straddle state borders, skewing state-level economic data. This report, the “U.S. Metropolitan Area Economic Freedom Index,” quantifies those intra-state disparities by providing a local-level version of the EFNA, ranking 382 metropolitan areas by their economic freedom levels.
Because there are important, population-driven differences between the largest metro areas and the smaller ones, for purposes of ranking them, they are divided into two groups: the 52 with 2012 population of one million or higher and the 330 with populations below one million. The top three large areas are Houston, Jacksonville, and Tampa; the bottom three are Riverside, Rochester, and Buffalo. Among the largest 52 MSAs, the top 10 consists of four areas in both Texas and Florida, and one each in Virginia and Tennessee. The bottom 10 has three in both California and New York, two in Ohio, and one each in Oregon and Rhode Island.
U.S. Metropolitan Area Economic Freedom Index Rankings
(Among the 52 largest MSAs with 2012 populations of more than one million)
- Houston-The Woodlands-Sugar Land, TX MSA
- Jacksonville, FL MSA
- Tampa-St. Petersburg-Clearwater, FL MSA
- Richmond, VA MSA
- Dallas-Fort Worth-Arlington, TX MSA
- Nashville-Davidson—Murfreesboro—Franklin, TN MSA
- Miami-Fort Lauderdale-West Palm Beach, FL MSA
- Austin-Round Rock, TX MSA
- Orlando-Kissimmee-Sanford, FL MSA
- San Antonio-New Braunfels, TX MSA
- Washington-Arlington-Alexandria, DC-VA-MD-WV MSA
- Oklahoma City, OK MSA
- Virginia Beach-Norfolk-Newport News, VA-NC MSA
- Atlanta-Sandy Springs-Roswell, GA MSA
- Raleigh, NC MSA
- Baltimore-Columbia-Towson, MD MSA
- Boston-Cambridge-Quincy, MA-NH MSA
- Denver-Aurora-Lakewood, CO MSA
- Phoenix-Mesa-Scottsdale, AZ MSA
- Memphis, TN-MS-AR MSA
- Indianapolis-Carmel-Anderson, IN MSA
- St. Louis, MO-IL MSA
- New Orleans-Metairie, LA MSA
- Kansas City, MO-KS MSA
- Salt Lake City, UT MSA
- Birmingham-Hoover, AL MSA
- San Jose-Sunnyvale-Santa Clara, CA MSA
- Hartford-West Hartford-East Hartford, CT MSA
- Milwaukee-Waukesha-West Allis, WI MSA
- Charlotte-Concord-Gastonia, NC-SC MSA
- Pittsburgh, PA MSA
- Seattle-Tacoma-Bellevue, WA MSA
- Minneapolis-St. Paul-Bloomington, MN-WI MSA
- Grand Rapids-Wyoming, MI MSA
- San Francisco-Oakland-Fremont, CA MSA
- Las Vegas-Henderson-Paradise, NV MSA
- Philadelphia-Camden-Wilmington, PA-NJ-DE-MD MSA
- San Diego-Carlsbad, CA MSA
- Louisville-Jefferson County, KY-IN MSA
- Detroit-Warren-Dearborn, MI MSA
- Cincinnati-Middleton, OH-KY-IN MSA
- Chicago-Naperville-Elgin, IL-IN-WI MSA
- Los Angeles-Long Beach-Anaheim, CA MSA
- Providence-Warwick-Pawtucket, RI MSA
- Sacramento–Roseville–Arden-Arcadee, CA MSA
- Portland-Vancouver-Hillsboro, OR-WA MSA
- Columbus, OH MSA
- Cleveland-Elyria, OH MSA
- New York-Newark-Jersey City, NY-NJ-PA MSA
- Buffalo-Cheektowaga-Niagara Falls, NY MSA
- Rochester, NY MSA
- Riverside-San Bernardino-Ontario, CA MSA
When it comes to smaller metro areas, Naples, FL, Midland, TX, and Sebastian-Vero Beach, FL, offer the most economic freedom. The bottom three, or least free, smaller metro areas are El Centro, CA, Kingston, NY, and Visalia-Porterville, CA. Rankings for all 382 MSAs are available in the complete spreadsheet.
There are three areas of economic freedom measured in the EFNA, and in this local index. Area 1 measures government spending, Area 2 measures taxes, and Area 3 measures labor. There are three variables used in each of those three areas. For each of those nine variables, the raw data is converted to a standardized 0 to 10 score, in which the value representing highest economic freedom gets a 10, the one representing lowest economic freedom gets a 0, and all others are given a score proportionately in between 0 and 10. For more details on the rankings and methodology, please see the appendix.
Full Report: U.S. Metropolitan Area Economic Freedom Index
Infographic: U.S. Metropolitan Area Economic Freedom Index
Download the Complete Rankings, Tables and Figures For All 382 Markets (.xlsx)