

In recent years, transportation automation technologies and their associated impacts have been widely discussed in academic, public policy, and news media environments. Most of this discussion has focused on self-driving cars, which are currently being tested by dozens of developers. Automated trucking has also seen sizable interest. But rail automation and especially automation in freight rail has garnered little attention, despite the large potential for automation-spurred safety and efficiency improvements.
The U.S. enjoys the largest and most productive freight rail network in the world. This network is privately owned, operated, and maintained, with freight rail being the least subsidized mode of transportation in the U.S. However, recent changes in rail traffic, as well as research and development activities in competing modes, underscore the need for freight rail carriers to innovate in order to remain an important segment of the transportation sector in the 21st century and beyond. The successful development and deployment of automation technologies in the future is key to ensuring freight rail’s ongoing success.
This brief examines the current freight rail automation landscape. It begins by summarizing the current state of the U.S. freight rail industry, surveys recent freight rail automation development activities as well as those in competing transportation modes, continues with a discussion of current policy barriers to increasing automation in the freight rail industry and concludes with recommendations for policymakers.
Today’s Freight Industry and Tomorrow’s Competition
Freight rail is well-positioned to remain viable and competitive in the U.S. during the 21st century. However, the industry must innovate to ensure this occurs. This part of the brief surveys the current state of U.S. freight rail, automation technology development activities in competing modes, and automation technology development in the freight rail industry.
The U.S. contains the world’s most extensive and productive freight rail network.1Arne Beck, et al., “Railway Efficiency: An Overview and a Look at Opportunities for Improvement,” International Transport Forum, Discussion Paper No. 2013-12 (May 2013). https://www.itf-oecd.org/ sites/default/files/docs/dp201312.pdf (accessed 23 June 2021). Carriers are privately owned and play a significant role in the broader transportation sector. But in the relatively recent past, the U.S. railroad industry was in decline and facing collapse as generations of counterproductive economic regulation took their toll.2Clifford Winston, The Success of the Staggers Rail Act of 1980, (Washington: AEI-Brookings Joint Center for Regulatory Studies, Oct. 2005). https://www.brookings.edu/wp-content/uploads/2016/06/10
_railact_winston.pdf. Fortunately, a bipartisan consensus recognizing the harm of over-regulation formed in the 1970s. Shortly thereafter, the federal government began deregulating the industry, which culminated in the Staggers Rail Act of 1980.3Staggers Rail Act of 1980, 94 Stat. 1895, Pub. L. 96–448 (14 Oct. 1980).
Partial economic deregulation under the Staggers Act led to falling freight rates and better service for customers, revitalization of national rail network infrastructure, improved safety, and more rapid uptake of new technologies and practices. Since 1980, average inflation-adjusted freight rates have fallen by 44%,4Association of American Railroads, “Freight Railroads Under Balanced Economic Regulation,” (Washington: Association of American Railroads: April 2021). https://www.aar.org/wp-content/uploads/ 2020/08/AAR-Railroads-Under-Balanced-Economic-Regulation-Fact-Sheet.pdf (accessed 23 June 2021). train accident rates are down 75%,5Association of American Railroads, Railroad Facts 2020 Edition, (Washington: Association of American Railroads, 2020). 62. employee injuries and occupational illnesses have fallen by 83%,6Ibid. 63 all while freight railroads have invested more than $740 billion of their own funds to revitalize their networks to support a 75% increase in freight volume.7Association of American Railroads, “Freight Railroads Under Balanced Economic Regulation”; Association of American Railroads, Railroad Facts 2020 Edition. 30.
In contrast to its dismal outlook in the pre-Staggers 1970s, freight rail has reemerged as a vital freight mode in the U.S. Today, freight rail effectively competes with road, water, and pipeline transportation. Figure 1 displays the changing modal mix of freight transportation volume over the last four decades in U.S., where total annual freight volume moved by all modes now tops 5.2 trillion ton-miles.
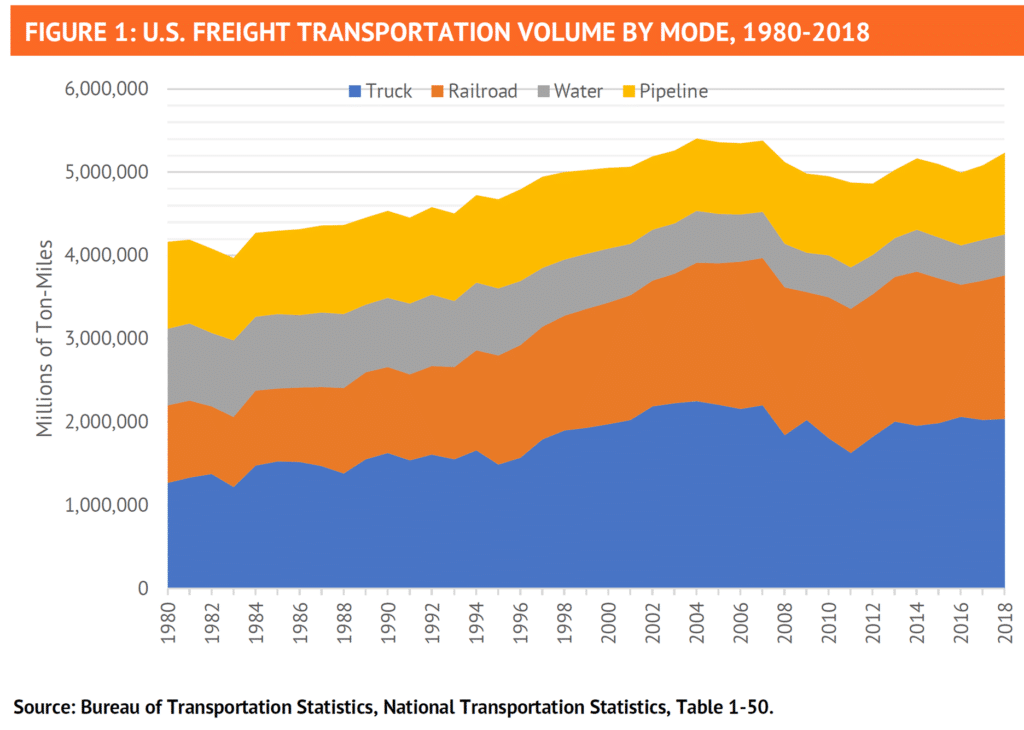
Shippers may use a variety of modes depending on the circumstances. Pipeline, waterway, and rail freight transportation tend to offer significantly lower rates, greater capacity, and less environmental impact when compared to trucking, but trucking generally remains the faster and more flexible option. As such, mode choice is determined by factors such as network access, physical characteristics of the commodity being shipped, commodity value, and the value of time-in-transit.
Class I railroads are the largest railroads and own nearly 160,000 miles of track on nearly 93,000 miles of road, which forms the core National Rail Network.8Association of American Railroads, Railroad Facts 2020 Edition. 47. Some roads have multiple track segments, accounting for the difference between miles of road and miles of track. Class I railroads are defined by the Surface Transportation Board on a revenue basis, for which a $250 million annual revenue threshold was established in 1992 and is annually adjusted for inflation. For 2019, the Class I revenue threshold was just under $505 million.“9Railroad Revenue Deflator Factors,” STB.gov, Surface Transportation Board, https://prod.stb.gov/ reports-data/economic-data/railroad-revenue-deflator-factors/ (accessed 13 May 2021). Although there are several hundred freight railroads operating today in the U.S., the seven Class I railroads account for approximately 68% of freight rail mileage, 88% of employees, and 94% of revenue.10Association of American Railroads, “Railroad 101” (Washington: Association of American Railroads, April 2021). https://www.aar.org/wp-content/uploads/2020/08/AAR-Railroad-101-Freight-Railroads-Fact-Sheet.pdf. Table 1 ranks Class I railroads by revenue and includes statistics on carrier operations.
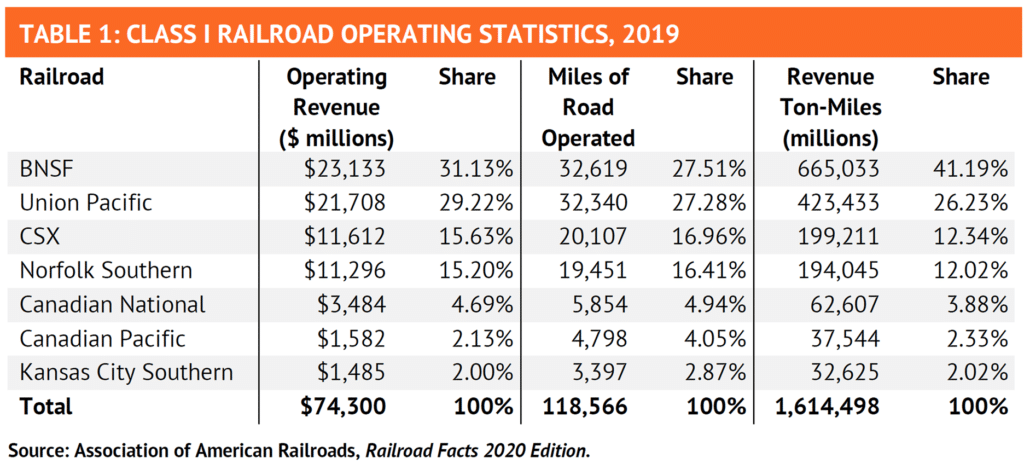
As Table 1 indicates, the four largest Class I railroads account for 91.18% of operating revenue, 88.16% of miles of road operated, and 91.78% of ton-miles among the seven Class I carriers. The two largest (BNSF and Union Pacific) compete most directly in the western and midwestern U.S. The third and fourth largest (CSX and Norfolk Southern) compete most directly in the northeastern and southeastern U.S. Fifth-largest Canadian National competes most directly with sixth-largest Canadian Pacific in the north, while also competing with the smallest Class I carrier Kansas City Southern on north-south traffic in the center of the continental U.S. Figure 2 shows the extent of service provided by these carriers on a North American rail network map.
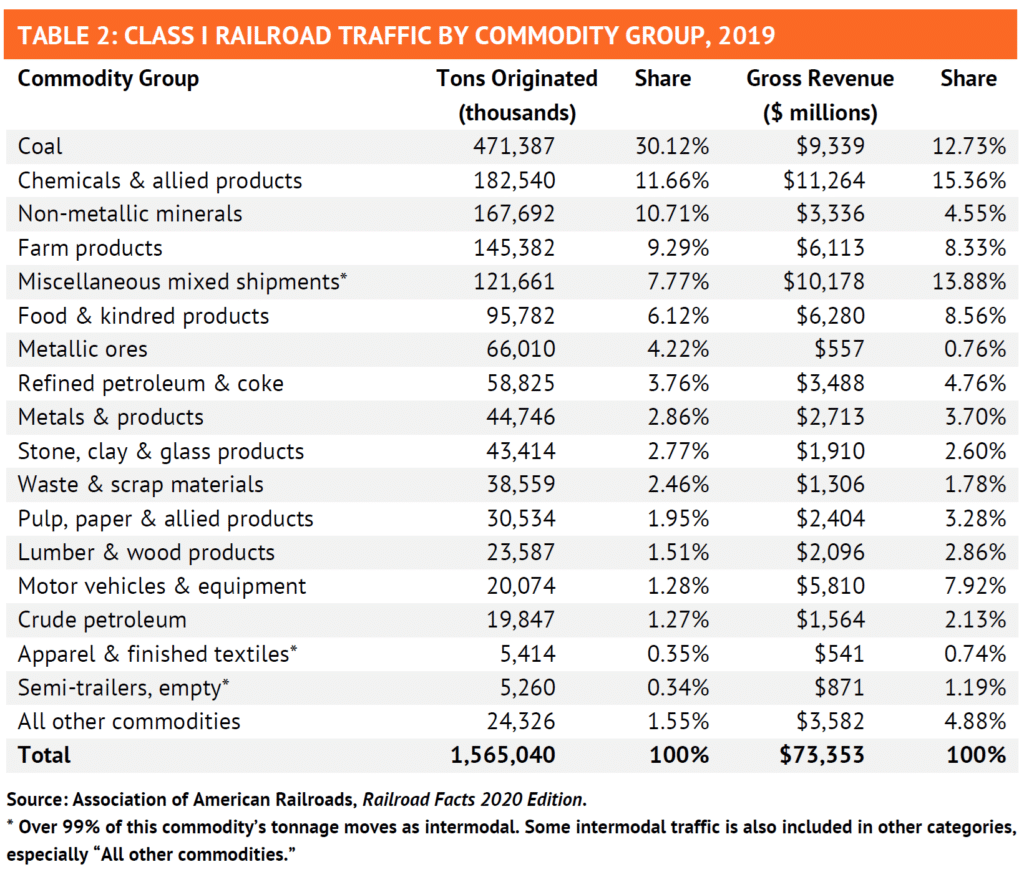
Railroads have long served as the backbone of bulk commodity movements, especially in areas where inland waterway barge transportation is not feasible. Historically, coal was the largest single commodity group moved by rail, accounting for 30.12% of tons originated and 12.73% of gross revenue in 2019.11Association of American Railroads, Railroad Facts 2020 Edition. 32. However, the sharp decline of coal-fired electricity generation has led coal-by-rail tonnage to decline by nearly half since 2008.12Ibid. 34.
Since partial deregulation of the railroad industry under the Staggers Act, the fastest growing traffic segment has been intermodal—the shipping containers and trailers that can be moved between rail, truck, and waterborne carriers—where intermodal rail traffic increased by nearly 350% between 1980 and 2019.13Ibid. 29. Intermodal rail traffic in 2019 accounted for more than 8.46% of total tons originated and more than 15.81% of gross revenue, which would constitute the largest revenue share of any commodity group if intermodal traffic was grouped together. Much of the future growth of intermodal traffic on rail is likely to depend on how adequately rail can compete with and complement over-the-road trucking.
Table 2 ranks Class I railroad commodity groups by tons originated and includes information on revenue by commodity group.
The 21st-century competitive landscape of freight transportation is likely to be largely determined by future advances in transportation technology, especially automation.
Full Policy Brief: Pathways and Policy for 21st Century Freight Rail